Technology
Internet Browser Market Share (1996–2019)
Internet Browser Market Share (1996–2019)
Web browsers are a ubiquitous part of the internet experience and one of the most commonly used digital tools of the modern era.
Since the first rudimentary interfaces were created in the 1990s, a number of browsers have entered the market, with a select few achieving market dominance over our access to web content.
Today’s bar chart race video, by the YouTube channel Data is Beautiful, is a nostalgic look back at how people used to access the internet, from Mosaic to Chrome.
The First Wave of Browsers
Simply put, web browsers are the software applications that act as our portal to the internet. Today, aside from the occasional pop-up box, we barely notice them. In the early ’90s though, when the web was in its infancy, the crude, boxy interfaces were a revolutionary step in making the internet usable to people with access to a computer.
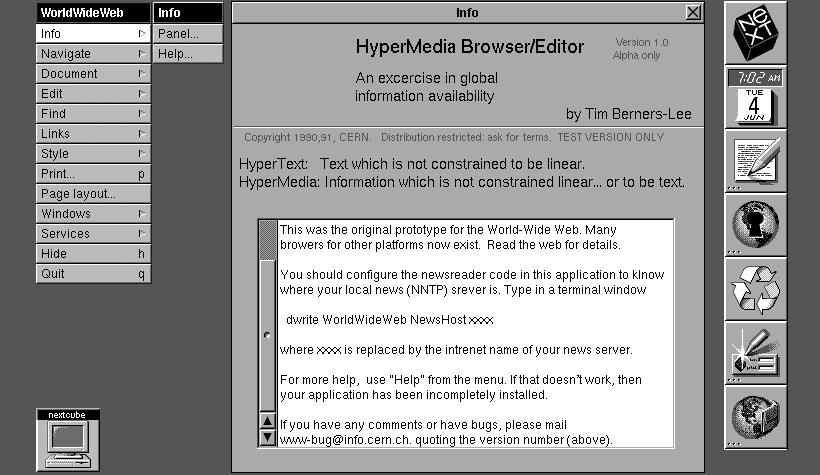
The first step in this journey came in 1990, when the legendary Tim Berners-Lee developed the first-ever web browser called “WorldWideWeb” – later renamed Nexus. Nexus was a graphical user interface (GUI) that allowed users to view text on web pages. Images were still beyond reach, but since most connections were dial-up, that wasn’t much of a limitation at the time.
The precurser to the modern browser was Mosaic, originally developed as a temporary project by the the University of Illinois at Urbana–Champaign (UIUC) and the National Center for Supercomputing Applications (NCSA).
After his graduation from UIUC in 1993, Marc Andreessen teamed up with Jim Clark, the founder of Silicon Graphics, to produce a commercial version of the browser. The resulting software, Netscape Navigator, became the first widely used browser, moving the internet from an abstract concept to a network that was accessible to everyday people. The company soon staged a wildly popular IPO, which saw the 16-month-old startup reach a valuation of nearly $3 billion.
Naturally, the fanfare surrounding Netscape had captured Microsoft’s attention. Immediately after Netscape’s IPO, the first version of Internet Explorer (building off a licensed version of Mozilla) was released. The browser wars had begun.
The Internet Explorer Era
In 1995, Bill Gates was looking to capitalize on the “Internet Tidal Wave”, and was up to the challenge of eating into Netscape’s market share, which stood at about 90%.
A new competitor “born” on the Internet is Netscape. We have to match and beat their offerings…
– Bill Gates
Ultimately, Netscape was no match for Internet Explorer (IE) once it was bundled with the Windows operating system. By the dawn of the new millennium (beware Y2K!) the situation had reversed, with IE capturing over 75% of the browser market share.
With Netscape mostly out of the picture, IE had a stranglehold on the market. In fact, Microsoft’s position was so comfortable that after IE6 was released 2001, the next full version wouldn’t ship until 2006.
It was during this time that a new player came onto the scene. Mozilla Firefox was officially launched in 2004, seeing over 60 million downloads within its first nine months. For the first time in years, Microsoft began to feel the heat of competition.
Goliath and Goliath
Despite the growing popularity for Mozilla Firefox, it was a browser backed by another tech giant that would eventually lead to IE’s downfall – Google Chrome.
Chrome was pitched to the public in 2008 as “a fresh take on the browser”. While Microsoft struggled with open web standards, Chrome’s source code was openly available through Google’s Chromium project.
By 2011, Firefox and Chrome had eroded IE’s market share to below 50%, and a year later, Chrome would end Internet Explorer’s 14-year reign as the world’s top internet browser.
Today, the browser market has come full circle. Chrome has now become the dominant browser on the market, while competitors fight to increase their single-digit market shares. IE has dropped to fourth place.
Looking Back at the Peaks
In the 25 years since Netscape gave people access to the internet, a few browsers have had their moment in the sun. Here are the years of peak market share for all the major browsers:
| Browser | Peak Market Share | Peak Year |
|---|---|---|
| Netscape Navigator | 90% | 1995 |
| Internet Explorer | 95% | 2004 |
| Opera | 3% | 2009 |
| Mozilla Firefox | 32% | 2010 |
| Safari | 7% | 2012 |
Once a browser becomes popular, it can be incredibly difficult to carve into its market share. Even during the height of the iPhone era, Apple’s browser, Safari, was only able to manage a 7% market share.
For now, it looks like Chrome will continue to be the world’s preferred method of experiencing the internet. If Chrome’s current trajectory continues, it could become the third major browser to surpass a 90% market share.

Digital Transformation
Mapped: The Number of AI Startups By Country
Over the past decade, thousands of AI startups have been funded worldwide. See which countries are leading the charge in this map graphic.
Mapped: The Number of AI Startups By Country
This was originally posted on our Voronoi app. Download the app for free on iOS or Android and discover incredible data-driven charts from a variety of trusted sources.
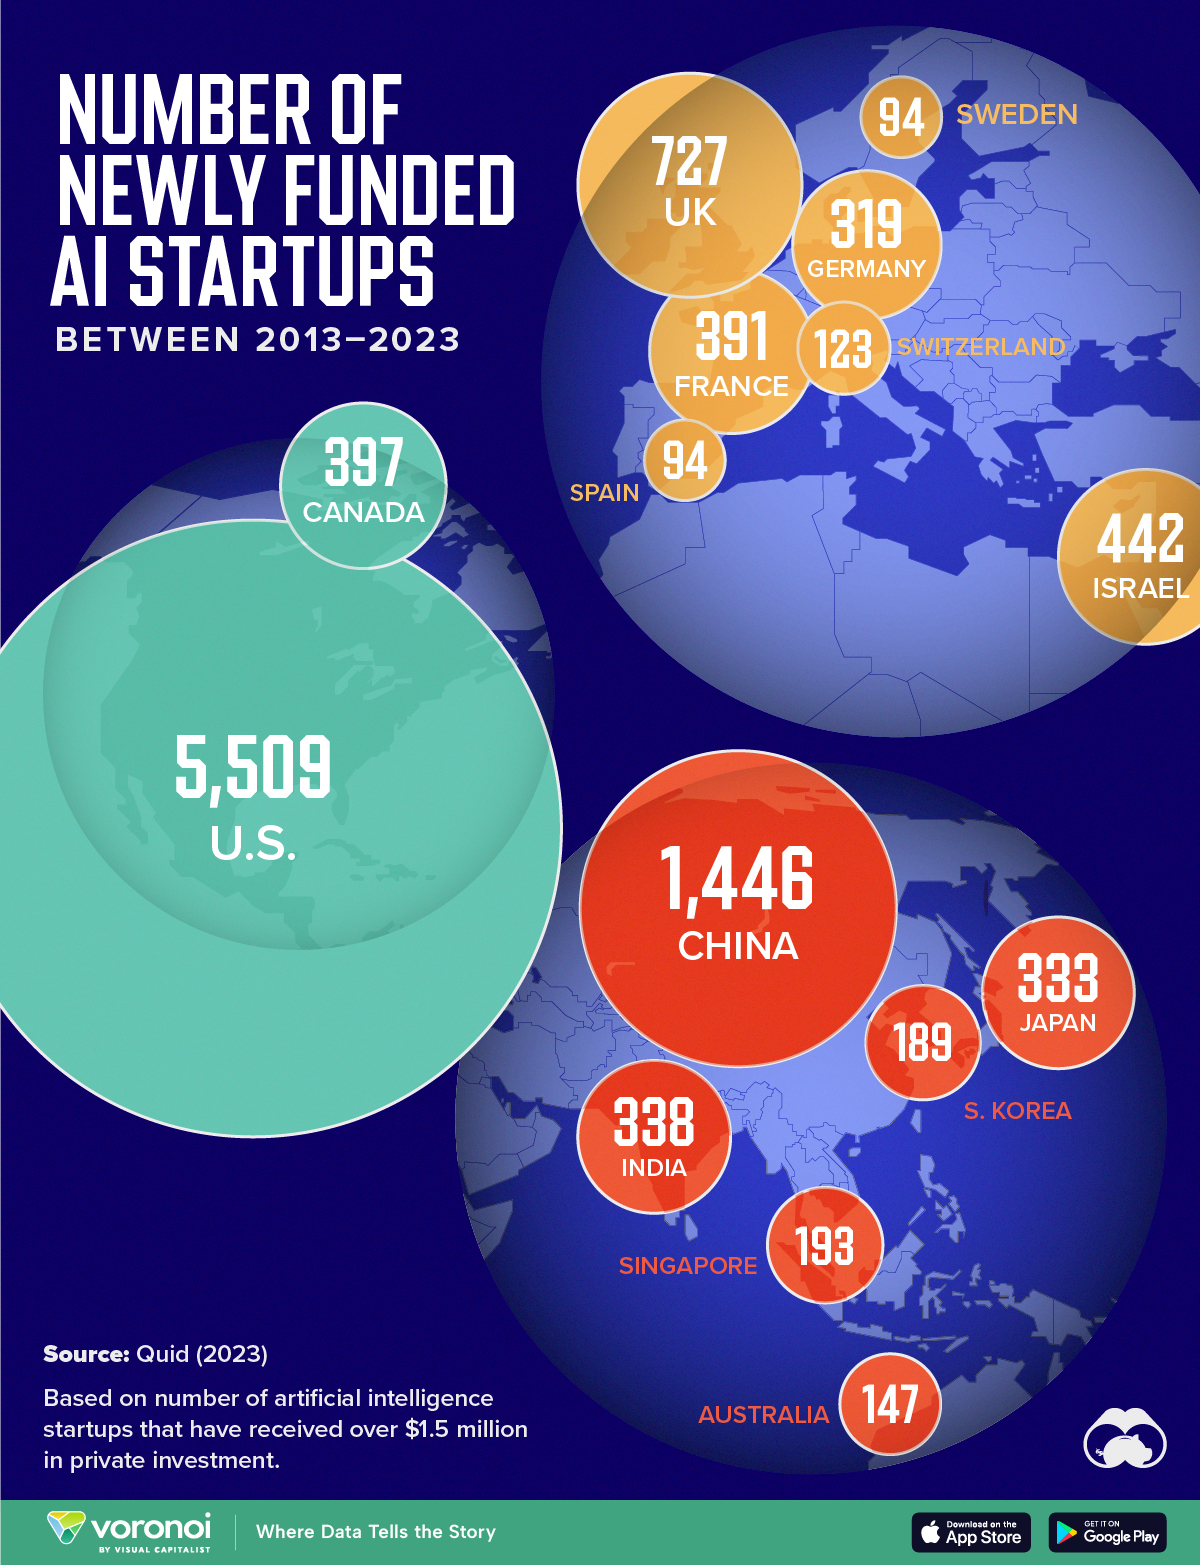
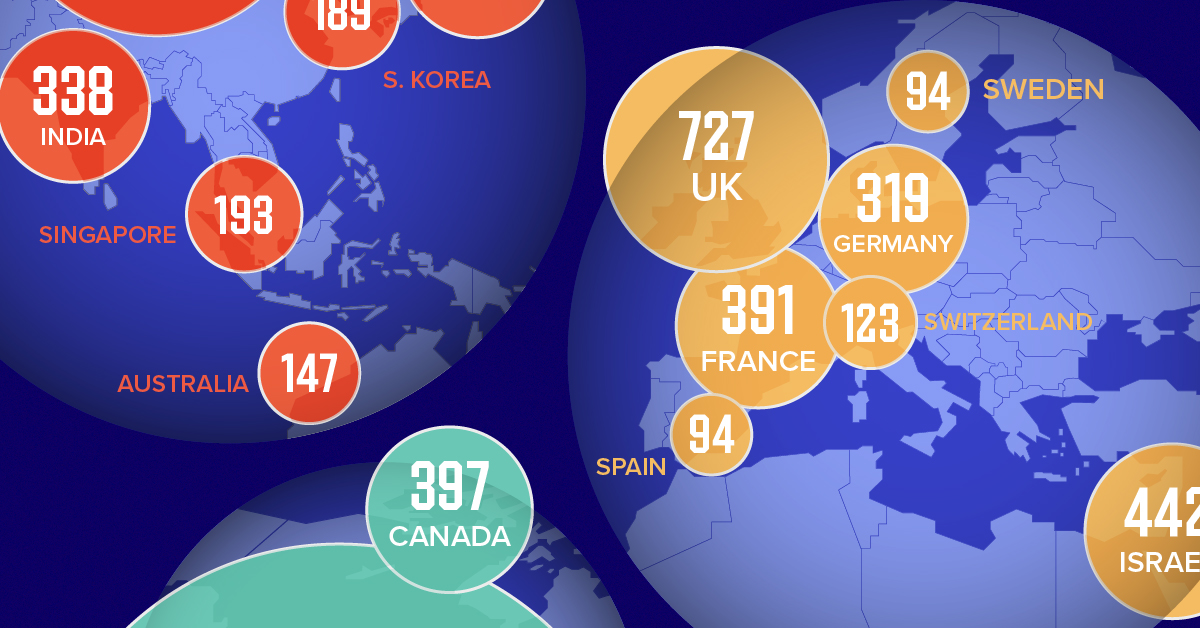
Amidst the recent expansion of artificial intelligence (AI), we’ve visualized data from Quid (accessed via Stanford’s 2024 AI Index Report) to highlight the top 15 countries which have seen the most AI startup activity over the past decade.
The figures in this graphic represent the number of newly funded AI startups within that country, in the time period of 2013 to 2023. Only companies that received over $1.5 million in private investment were considered.
Data and Highlights
The following table lists all of the numbers featured in the above graphic.
| Rank | Geographic area | Number of newly funded AI startups (2013-2023) |
|---|---|---|
| 1 | 🇺🇸 United States | 5,509 |
| 2 | 🇨🇳 China | 1,446 |
| 3 | 🇬🇧 United Kingdom | 727 |
| 4 | 🇮🇱 Israel | 442 |
| 5 | 🇨🇦 Canada | 397 |
| 6 | 🇫🇷 France | 391 |
| 7 | 🇮🇳 India | 338 |
| 8 | 🇯🇵 Japan | 333 |
| 9 | 🇩🇪 Germany | 319 |
| 10 | 🇸🇬 Singapore | 193 |
| 11 | 🇰🇷 South Korea | 189 |
| 12 | 🇦🇺 Australia | 147 |
| 13 | 🇨🇭 Switzerland | 123 |
| 14 | 🇸🇪 Sweden | 94 |
| 15 | 🇪🇸 Spain | 94 |
From this data, we can see that the U.S., China, and UK have established themselves as major hotbeds for AI innovation.
In terms of funding, the U.S. is massively ahead, with private AI investment totaling $335 billion between 2013 to 2023. AI startups in China raised $104 billion over the same timeframe, while those in the UK raised $22 billion.
Further analysis reveals that the U.S. is widening this gap even more. In 2023, for example, private investment in the U.S. grew by 22% from 2022 levels. Meanwhile, investment fell in China (-44%) and the UK (-14.1%) over the same time span.
Where is All This Money Flowing To?
Quid also breaks down total private AI investment by focus area, providing insight into which sectors are receiving the most funding.
| Focus Area | Global Investment in 2023 (USD billions) |
|---|---|
| 🤖 AI infrastructure, research, and governance | $18.3 |
| 🗣️ Natural language processing | $8.1 |
| 📊 Data management | $5.5 |
| ⚕️ Healthcare | $4.2 |
| 🚗 Autonomous vehicles | $2.7 |
| 💰 Fintech | $2.1 |
| ⚛️ Quantum computing | $2.0 |
| 🔌 Semiconductor | $1.7 |
| ⚡ Energy, oil, and gas | $1.5 |
| 🎨 Creative content | $1.3 |
| 📚 Education | $1.2 |
| 📈 Marketing | $1.1 |
| 🛸 Drones | $1.0 |
| 🔒 Cybersecurity | $0.9 |
| 🏭 Manufacturing | $0.9 |
| 🛒 Retail | $0.7 |
| 🕶️ AR/VR | $0.7 |
| 🛡️ Insurtech | $0.6 |
| 🎬 Entertainment | $0.5 |
| 💼 VC | $0.5 |
| 🌾 Agritech | $0.5 |
| ⚖️ Legal tech | $0.4 |
| 👤 Facial recognition | $0.3 |
| 🌐 Geospatial | $0.2 |
| 💪 Fitness and wellness | $0.2 |
Attracting the most money is AI infrastructure, research, and governance, which refers to startups that are building AI applications (like OpenAI’s ChatGPT).
The second biggest focus area is natural language processing (NLP), which is a type of AI that enables computers to understand and interpret human language. This technology has numerous use cases for businesses, particularly in financial services, where NLP can power customer support chatbots and automated wealth advisors.
With $8 billion invested into NLP-focused startups during 2023, investors appear keenly aware of this technology’s transformative potential.
Learn More About AI From Visual Capitalist
If you enjoyed this graphic, be sure to check out Visualizing AI Patents by Country.

-

 Energy6 days ago
Mapped: The Age of Energy Projects in Interconnection Queues, by State
-

 AI2 weeks ago
Visualizing AI Patents by Country
-

 Markets2 weeks ago
Economic Growth Forecasts for G7 and BRICS Countries in 2024
-

 Wealth2 weeks ago
Charted: Which City Has the Most Billionaires in 2024?
-

 Technology2 weeks ago
All of the Grants Given by the U.S. CHIPS Act
-

 Green1 week ago
The Carbon Footprint of Major Travel Methods
-

 United States1 week ago
Visualizing the Most Common Pets in the U.S.
-

 Culture1 week ago
The World’s Top Media Franchises by All-Time Revenue