How to Graph a Function
Your complete guide to expressing a function on a graph using 3 easy steps

Guide Preview: How to express a function on a graph.
Graphing functions helps you to analyze the behavior of various functions on the coordinate plane. This complete guide will explore and answer the following:
How to graph a function
How to express the behavior of a function on a graph
How to identify x and y-intercepts of a function
How to identify the asymptotes of a function
By visualizing the shape and movement of a function on a coordinate plane, we can gain insights into its properties and make predictions about its values.
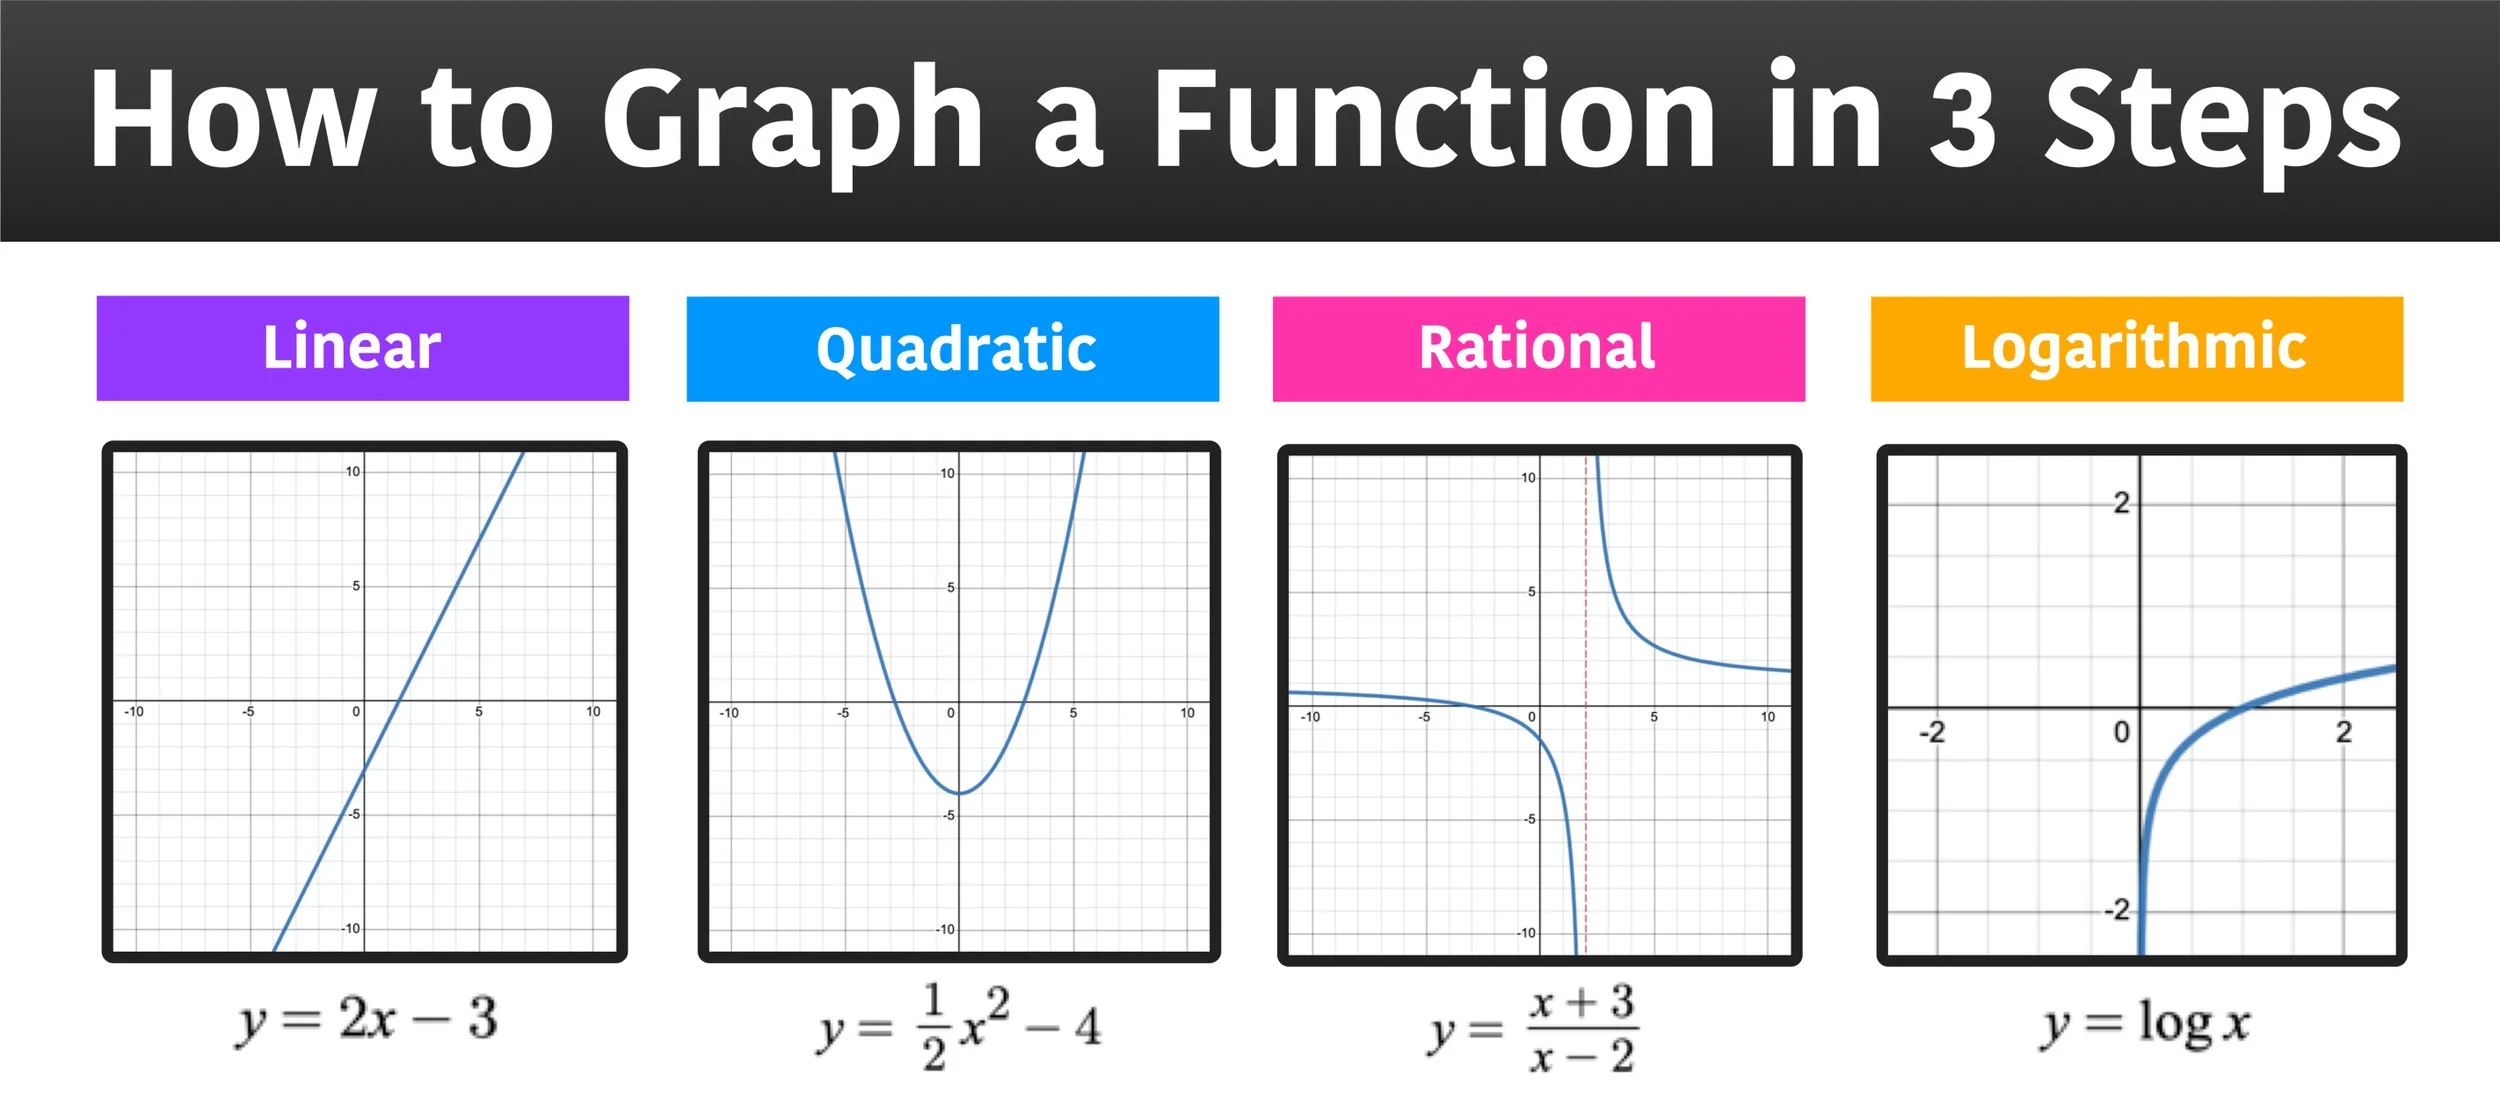
However, while it is relatively straightforward to graph a line (linear functions) or to graph a parabola (quadratic functions), higher-order and other complex functions generally are more tedious to work with. So this guide will teach you how to graph any function in 3 easy steps using the power of transformations and other graphing fundamentals.
How to Graph a Function: Key Concepts
A function is a mathematical way of defining a relationship between two or more variables. We can represent these relationships using mathematical symbols as we do in Algebra or visually by graphing the function on a cartesian plane.
By representing a function on a graph, we can identify various properties that may not be obvious otherwise. Some of the important properties that we can observe by graphing a function are:
Holes - input/s in a function that doesn’t output anything meaningful
Critical points - Intercepts, Maximum points, minimum points, and points of inflection are some of the crucial points that are useful for optimization problems, engineering, etc.
Vertical and Horizontal Asymptotes - Behaviors of functions as input tends to extremes such as positive or negative infinity
How to Graph a Function: 2 Approaches
There are two main approaches to drawing a function on a graph.
Plot several points (input-output pairs) of the function on a graph, and draw a straight line or smooth curve connecting the points. In this method generally the more points you plot, the more accurate the graph becomes.
Draw the parent graph of the function and then apply the relevant transformations to the graph on the cartesian plane. Click here to learn more about parent graphs and parent functions.
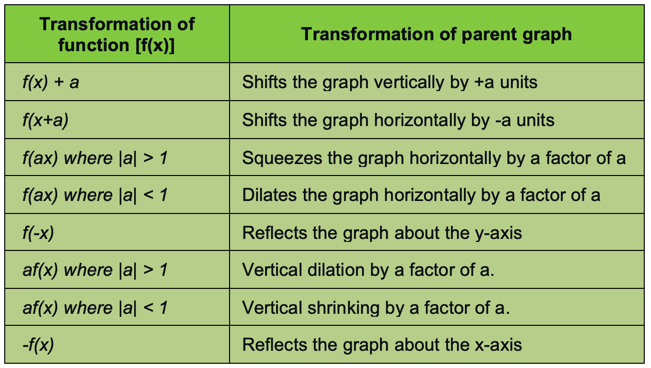
If you are graphing a function using transformations then you need to have a solid understanding of the various types of transformations. Below is a list of the basic transformations that can be seen in functions.
How to Graph a Function: Example #1 (Linear Function)
Let’s work out an example to understand the steps involved in visualizing a function on a graph.
Graph : f(x) = 2x - 3
To express this function on a graph (and all of the functions in this guide), we will be using the following 3-step method:
Step 1: Identify the critical points and/or any asymptotes
Step 2: Determine the points of the function
Step 3: Draw the Line or Curve and Extend
Now, let’s go ahead and apply these three steps to this first example:
Step 1: Identify the critical points and/or any asymptotes
In this example we have a linear function.
The critical points are the y and x intercepts.
y-intercept = -3 (value of function when x =0)
x-intercept = -3/2 (solution to f(x) = 0)
Step 2: Determine the points of the function
Here we can choose several values of x that are convenient and make sense in the context of the problem. The graph of a linear function is a straight line, hence determining two distinct points is sufficient to draw the graph. As we already have the x and y intercepts, we can move on to drawing the graph.
Step 3: Draw the Line or Curve and Extend
Use a ruler or straight edge to connect the points with a line. Extend the line as needed to cover the relevant domain and range of the function.
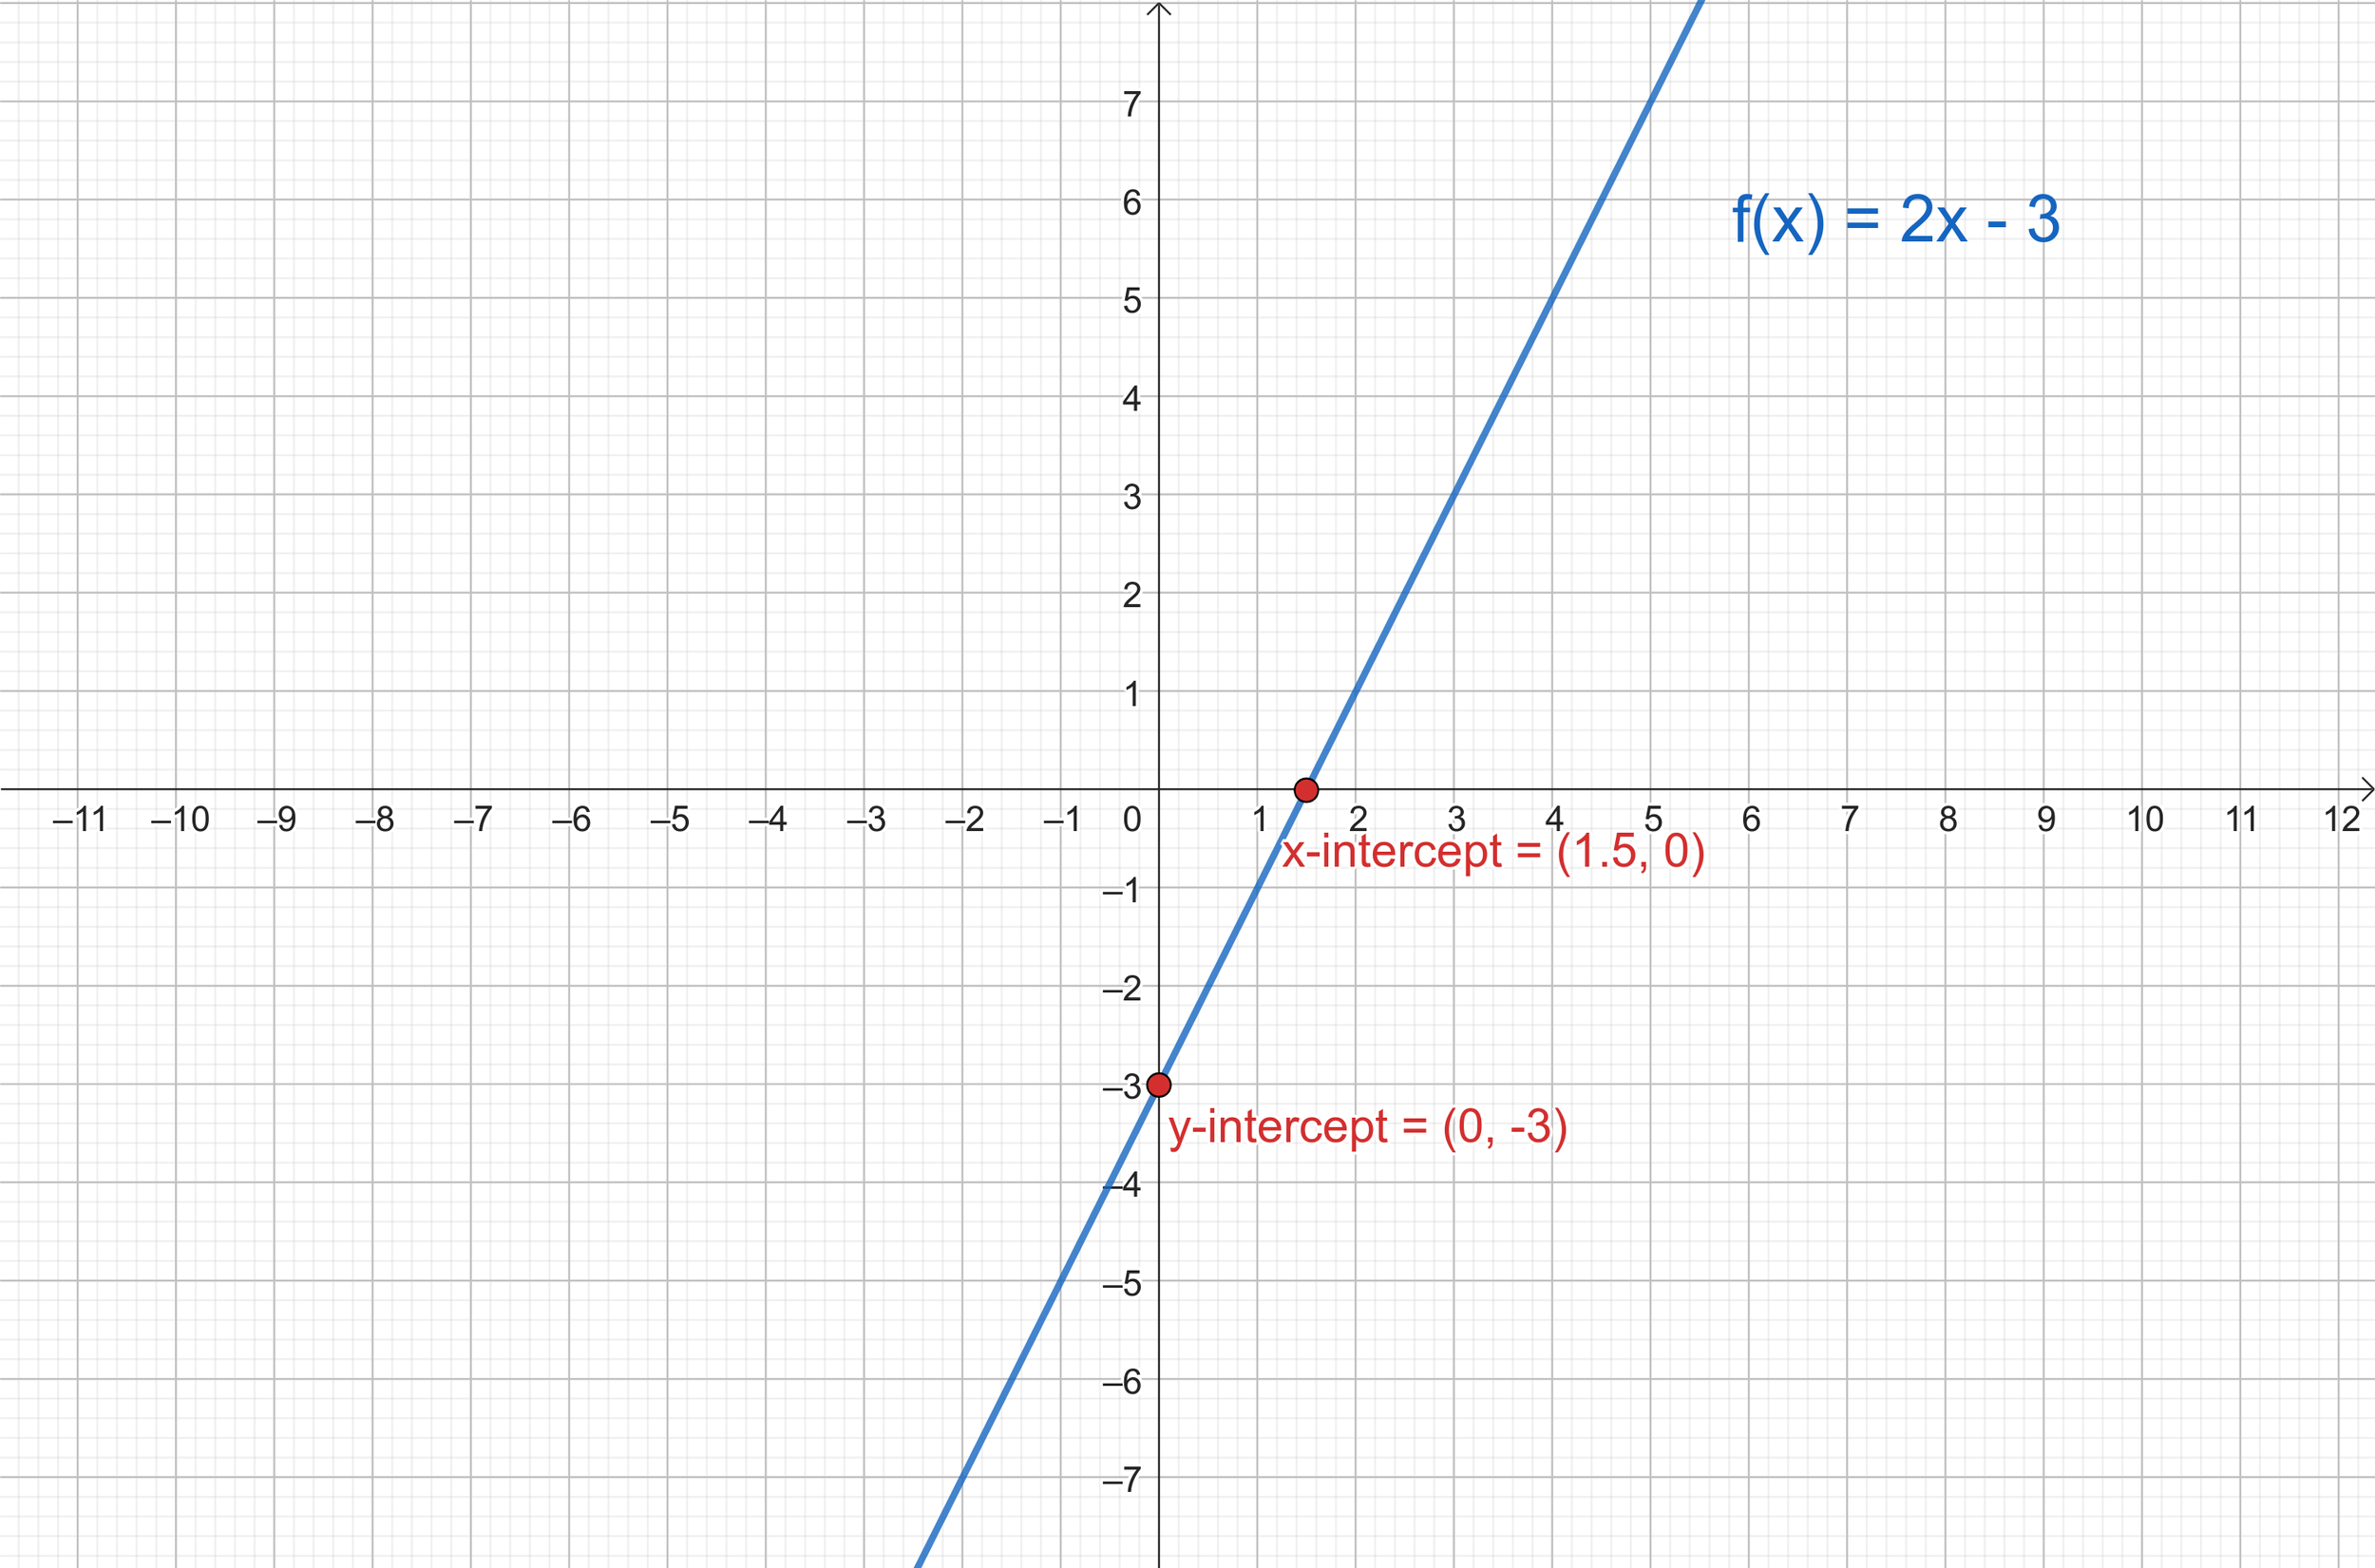
How to Graph a Function: Linear Function
How to Graph a Function: Example #2 (Quadratic Function)
Let’s try another example that involves a quadratic function
Graph : f(x) = 0.5x^2 -3x - 8
Step 1: Identify the critical points and/or any asymptotes
Y-intercept = -8
The x-intercept/s can be found by finding solutions to f(x) = 0 using the quadratic formula:
x = (-b ± √(b^2 - 4ac))/2a
x = (3± √((-3)^2 - 4(0.5)(-8)))/2(0.5)
X-intercepts : -2 and 8
The vertex is another critical point for quadratic functions, so let’s determine that as well.
The x-coordinate of the vertex of a quadratic function ax^2+bx+c is -b/2a
So for this function:
a = 0.5 and b = -3, hence the x-coordinate of the vertex is 3/1.
The y-coordinate of the vertex can be determined by plugging 3 in f(x).
f(3) = 0.5*(3)^2 - 3*(3) - 8
f(3) = -12.5
Vertex : (3, -12.5)
Step 2: Determine the points of the function
Choose several values of x on both sides of 3, and record the corresponding y values on a table.

Example #2: Function Table
Step 3: Draw the Line or Curve and Extend
Plot the points and Draw a smooth U-shaped curve that passes across all points.

How to Graph a Function: Quadratic Function
How to Graph a Function: Example #3 (Rational Function)
Let’s try graphing a rational function.
Graph : f(x) = (x+3)/(x-2)
When it comes to more complex functions such as rational functions we need to be more aware about the presence of asymptotes, holes, and other properties.
Step 1: Identify the critical points and/or any asymptotes
Y-intercept = (value of function when x =0)
X-intercept = -3 (solution to f(x) = 0)
We can equate the denominator of a rational function to identify any vertical asymptotes.
X - 2 = 0
X = 2, is a vertical asymptote of f(x)
The range of f(x) is {y ∈ R | y ≠ 1}, thus y = 1 will be a horizontal asymptote.
Step 2: Determine the points of the function
Choose several values of x on both sides of 2, and record the corresponding y values on a table.

Example #3: Function Table
Step 3: Draw the Line or Curve and Extend
Indicate the vertical and horizontal asymptote using dotted lines. Plot the points and draw a smooth curve/s connecting the points.

How to Graph a Function: Rational Function
How to Graph a Function: Example #4 (Logarithmic Function)
Graph: f(x) = 3log2x-2
Step 1: Identify the parent function
This is a logarithmic function, hence the parent function, p(x), would be log(x). The parent graph is:
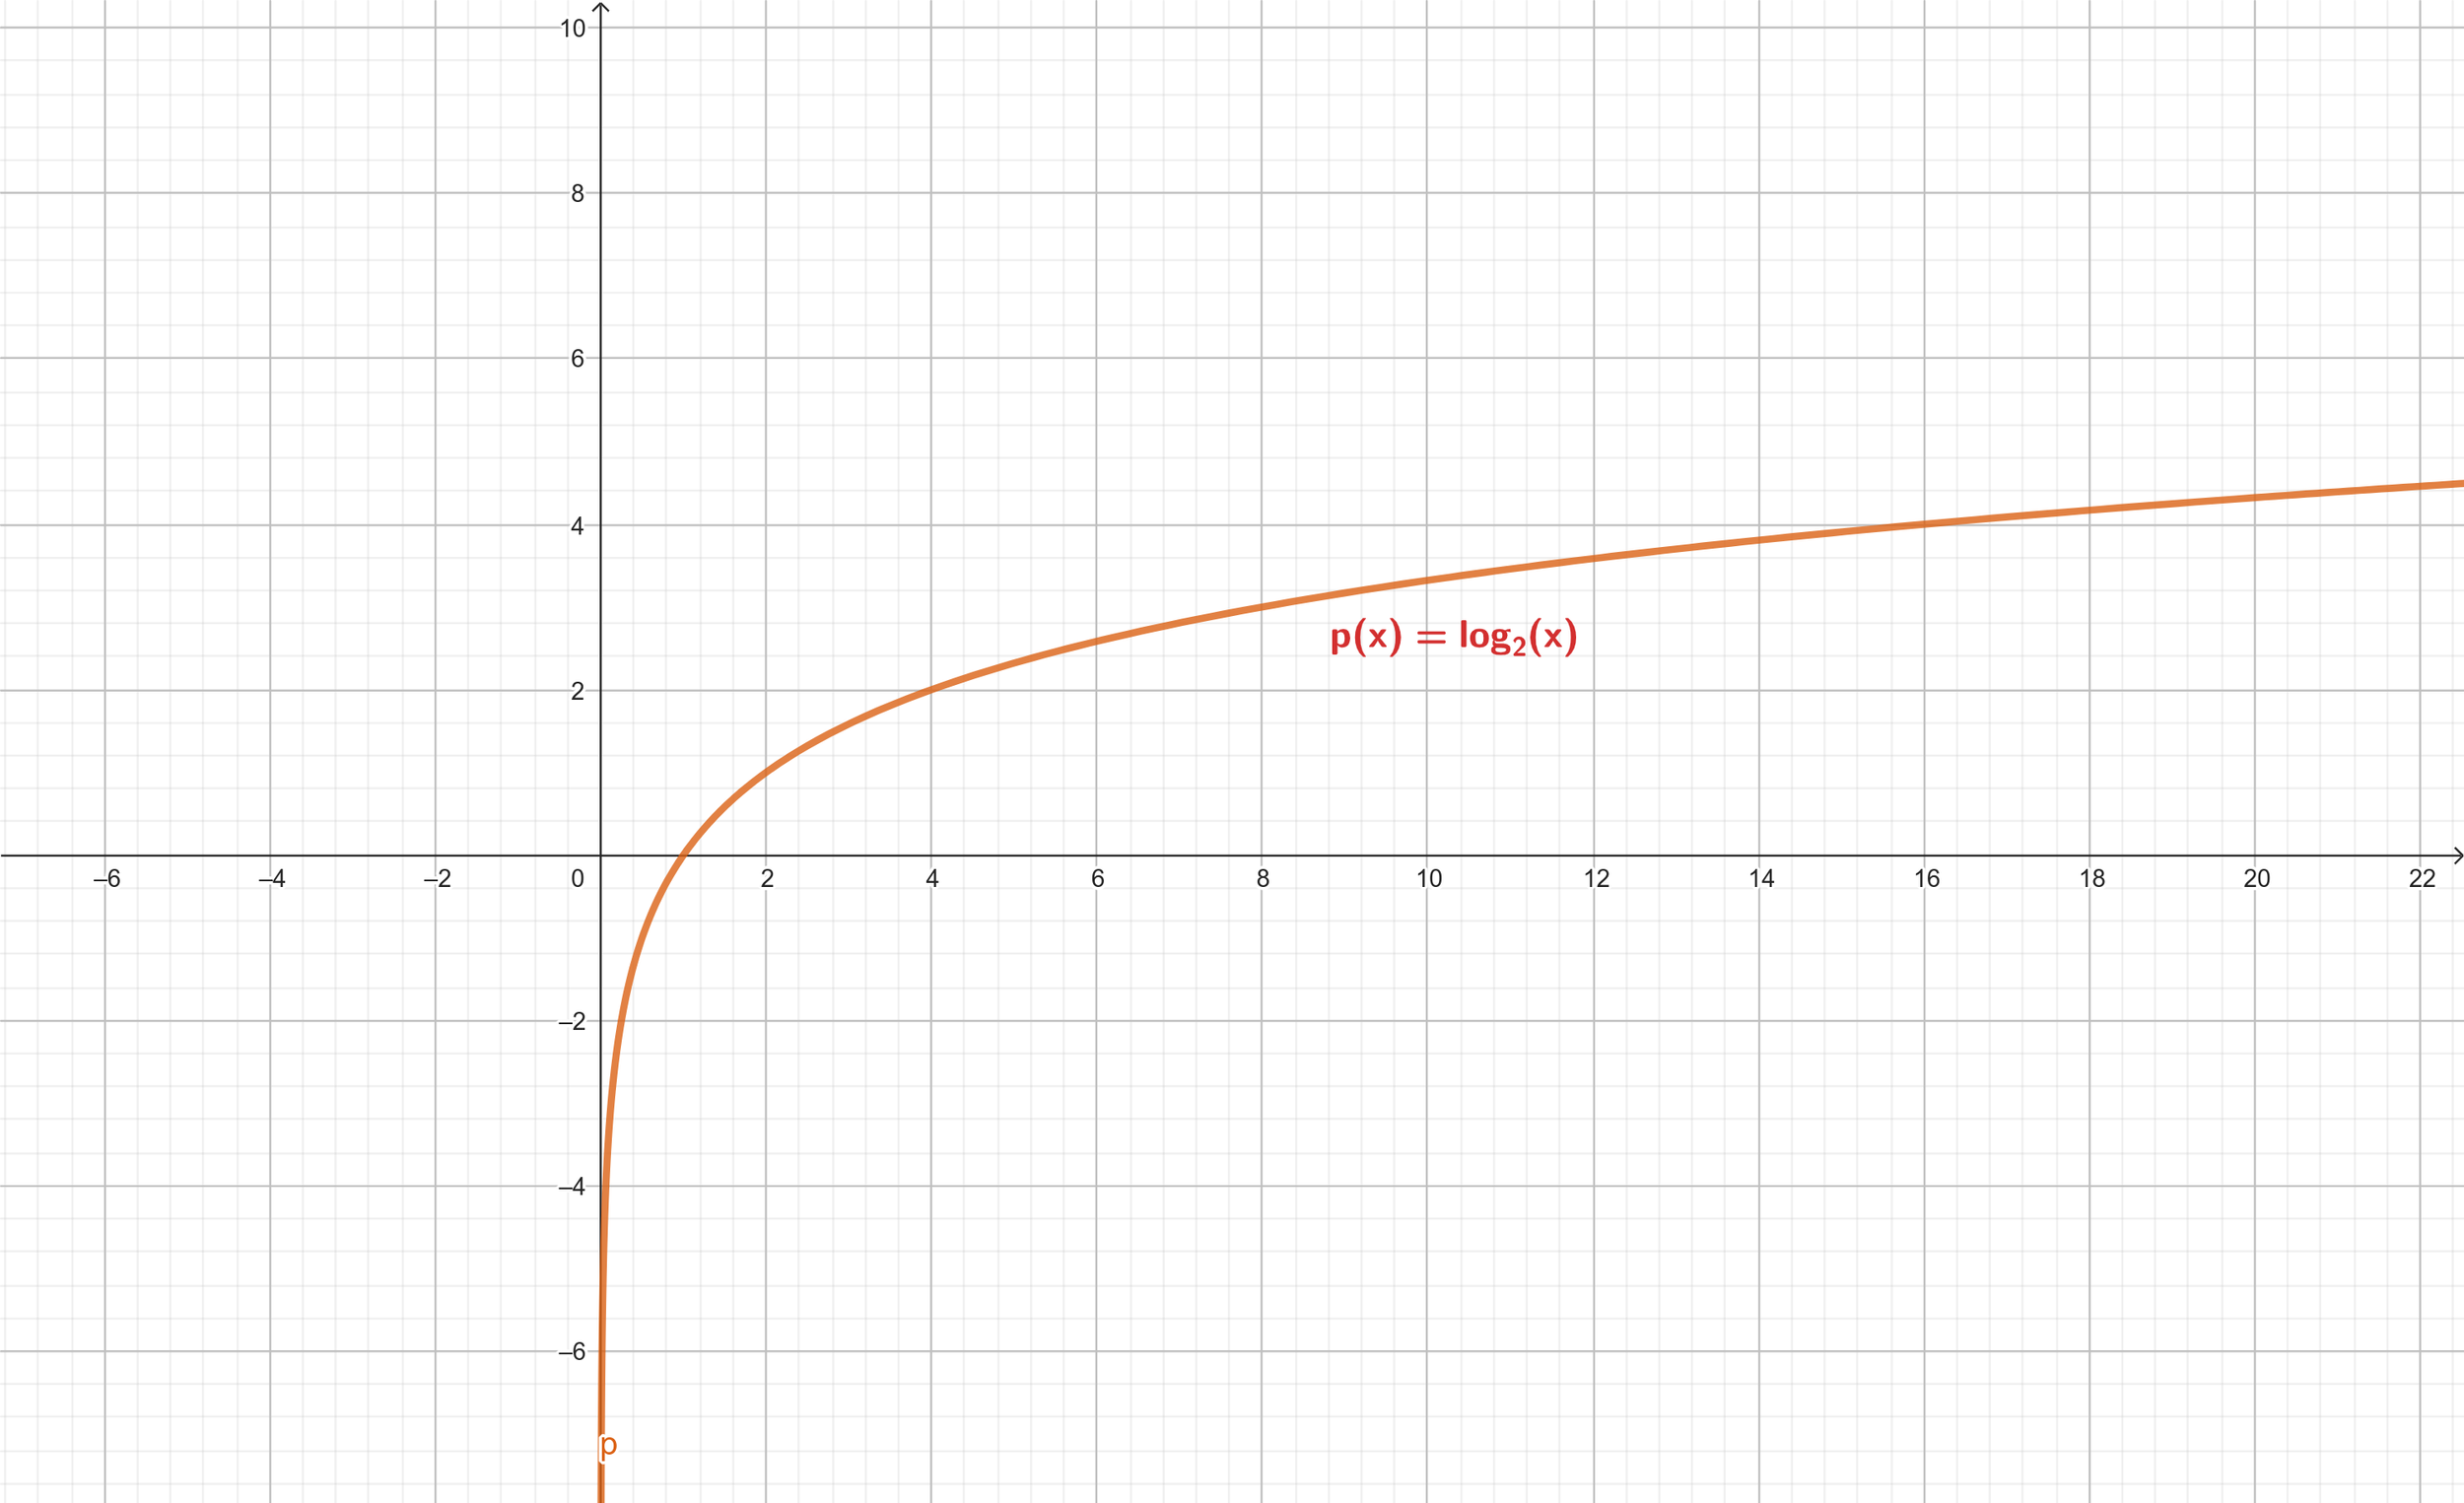
Logarithmic Parent Function
Step 2: Determine the transformations in f(x)
The function given in the example is made of a combination of two transformations.
log(x) -> - A Vertical dilation by a factor of 3
3log(x) -> - A vertical shift by -2 units
Step 3: Apply the transformations to the parent graph
Example #4: Transformation #1 (vertical dilation by a factor of 3)
Example #4: Transformation #2 (vertical shift by -2 units)
Expressing a Function on a Graph: Conclusion
The key information that needs to be obtained when representing any function on a graph are
Type of function
Critical points
Asymptotes
While linear and quadratic functions are easy to graph, more complex functions require more advanced techniques, such as applying transformations. By using the 3 step approach explained in this guide, you can accurately graph any function.
Keep Learning:
More Math Resources You Will Love: