Functional components profile and glycemic index of kidney beans
 Shengshu Xu
 Likang Qin
 Muhammad Mazhar
 Yong Zhu
- 1School of Liquor and Food Engineering, Guizhou University, Guiyang, China
- 2College of Life Sciences, Guizhou University, Guiyang, China
Low glycemic index (GI) diet has been considered as a strategy for type II diabetes patients. In the present study, the phenolics profile, α-amylase inhibitor activities, starch composition as well as the glycemic index of seven varieties of kidney beans were studied. An enzymatic inhibitory reaction model was employed to determine the α-amylase inhibitor activity, and the in vitro digestion model coupled with the 3, 5-dinitrosalicylic acid colorimetry method was adopted to evaluate the starch composition and glycemic index. The results showed that gallic acid was dominant in kidney beans, and the colored beans contained more phenolics than the white ones. In addition, the α-amylase inhibitor activities of kidney beans ranged from 1.659 ± 0.050 to 4.162 ± 0.049 U/g DW, among which the Y2 variety was the top-ranked. Furthermore, kidney beans starch demonstrated brilliant resistance to digestion with the contribution of resistant starch to total starch between 70.90 ± 0.39% and 83.12 ± 0.42%. Eventually, these kidney beans were categorized as low GI foods, which ranged from 32.47 ± 0.13 to 52.99 ± 0.56, the resistant starch makes dominant contribution to the low GI. These results indicate that kidney beans can be served as ingredients in functional low GI foods.
Introduction
Type II diabetes is a principal chronic disease that threatens human health which is initiated by the sugar metabolism disorder (1, 2). Accumulating evidences have shown that diets with a low glycemic index (GI) are efficient strategies to reduce the complications associated with type II diabetes (1, 3). The GI indicates the blood glucose response after intake a food with a specific amount of accessible carbohydrates compared with a reference food (4, 5).
Kidney bean (Phaseolus vulgaris L.) is one of the edible beans which includes red kidney bean, white kidney bean, red speckled kidney bean, and black kidney bean. They contain abundant phenolics, functional proteins, as well as other active ingredients that present antioxidant, hypoglycemic, and hypolipidemic properties (6, 7). Gallic acid, ferulic acid, catechin, p-hydroxybenzoic acid have been identified in beans (6, 8–10). Apart from antioxidant activity, phenolic compounds may also play a role in inhibiting α-glucosidase and lipase activities (10, 11). Kidney bean contains a glycoprotein named as α-amylase inhibitor (α-AI), which can inhibit starch digestion (12, 13). Previous studies showed that the α-AI proteins extracted from beans showed a strong inhibitory activity on α-amylase (14), and the ingestion of white bean extracts that contain α-AI can mitigate the obesity and regulate the gut microbiota of obese rats (15), furthermore, the resistant starch (RS) and phenolics were the dominant components that contribute to the low GI of starchy foods (16). As such, these active ingredients may possess the potential to control postprandial blood glucose levels (12, 17), which provide health benefits to the patients with type II diabetes (16, 18, 19).
In the present study, the functional properties of kidney beans were evaluated in aspects of phenolics and starch composition, α-AI activity as well as the potential blood glucose response, which provided the fundament for the application of kidney beans in low GI foods.
Materials and methods
Sample preparation
Seven varieties kidney beans with different coat colors—Weining white kidney bean, Biyun no.7, Qian yundou no.1, YJ009727A (serial number), Biyun1902, Biyun no.6, and Biyun no.3—were provided by the Guizhou Bijie Institute of Agricultural Sciences of China, which were labeled Y1, Y2, Y3, Y4, Y5, Y6, and Y7, respectively (Figure 1). These kidney beans were crushed into powder using a high-speed universal crusher, and they were then screened using a 40-mesh sieve and subsequently stored at −20°C for further analysis. White bread was purchased from a local supermarket.
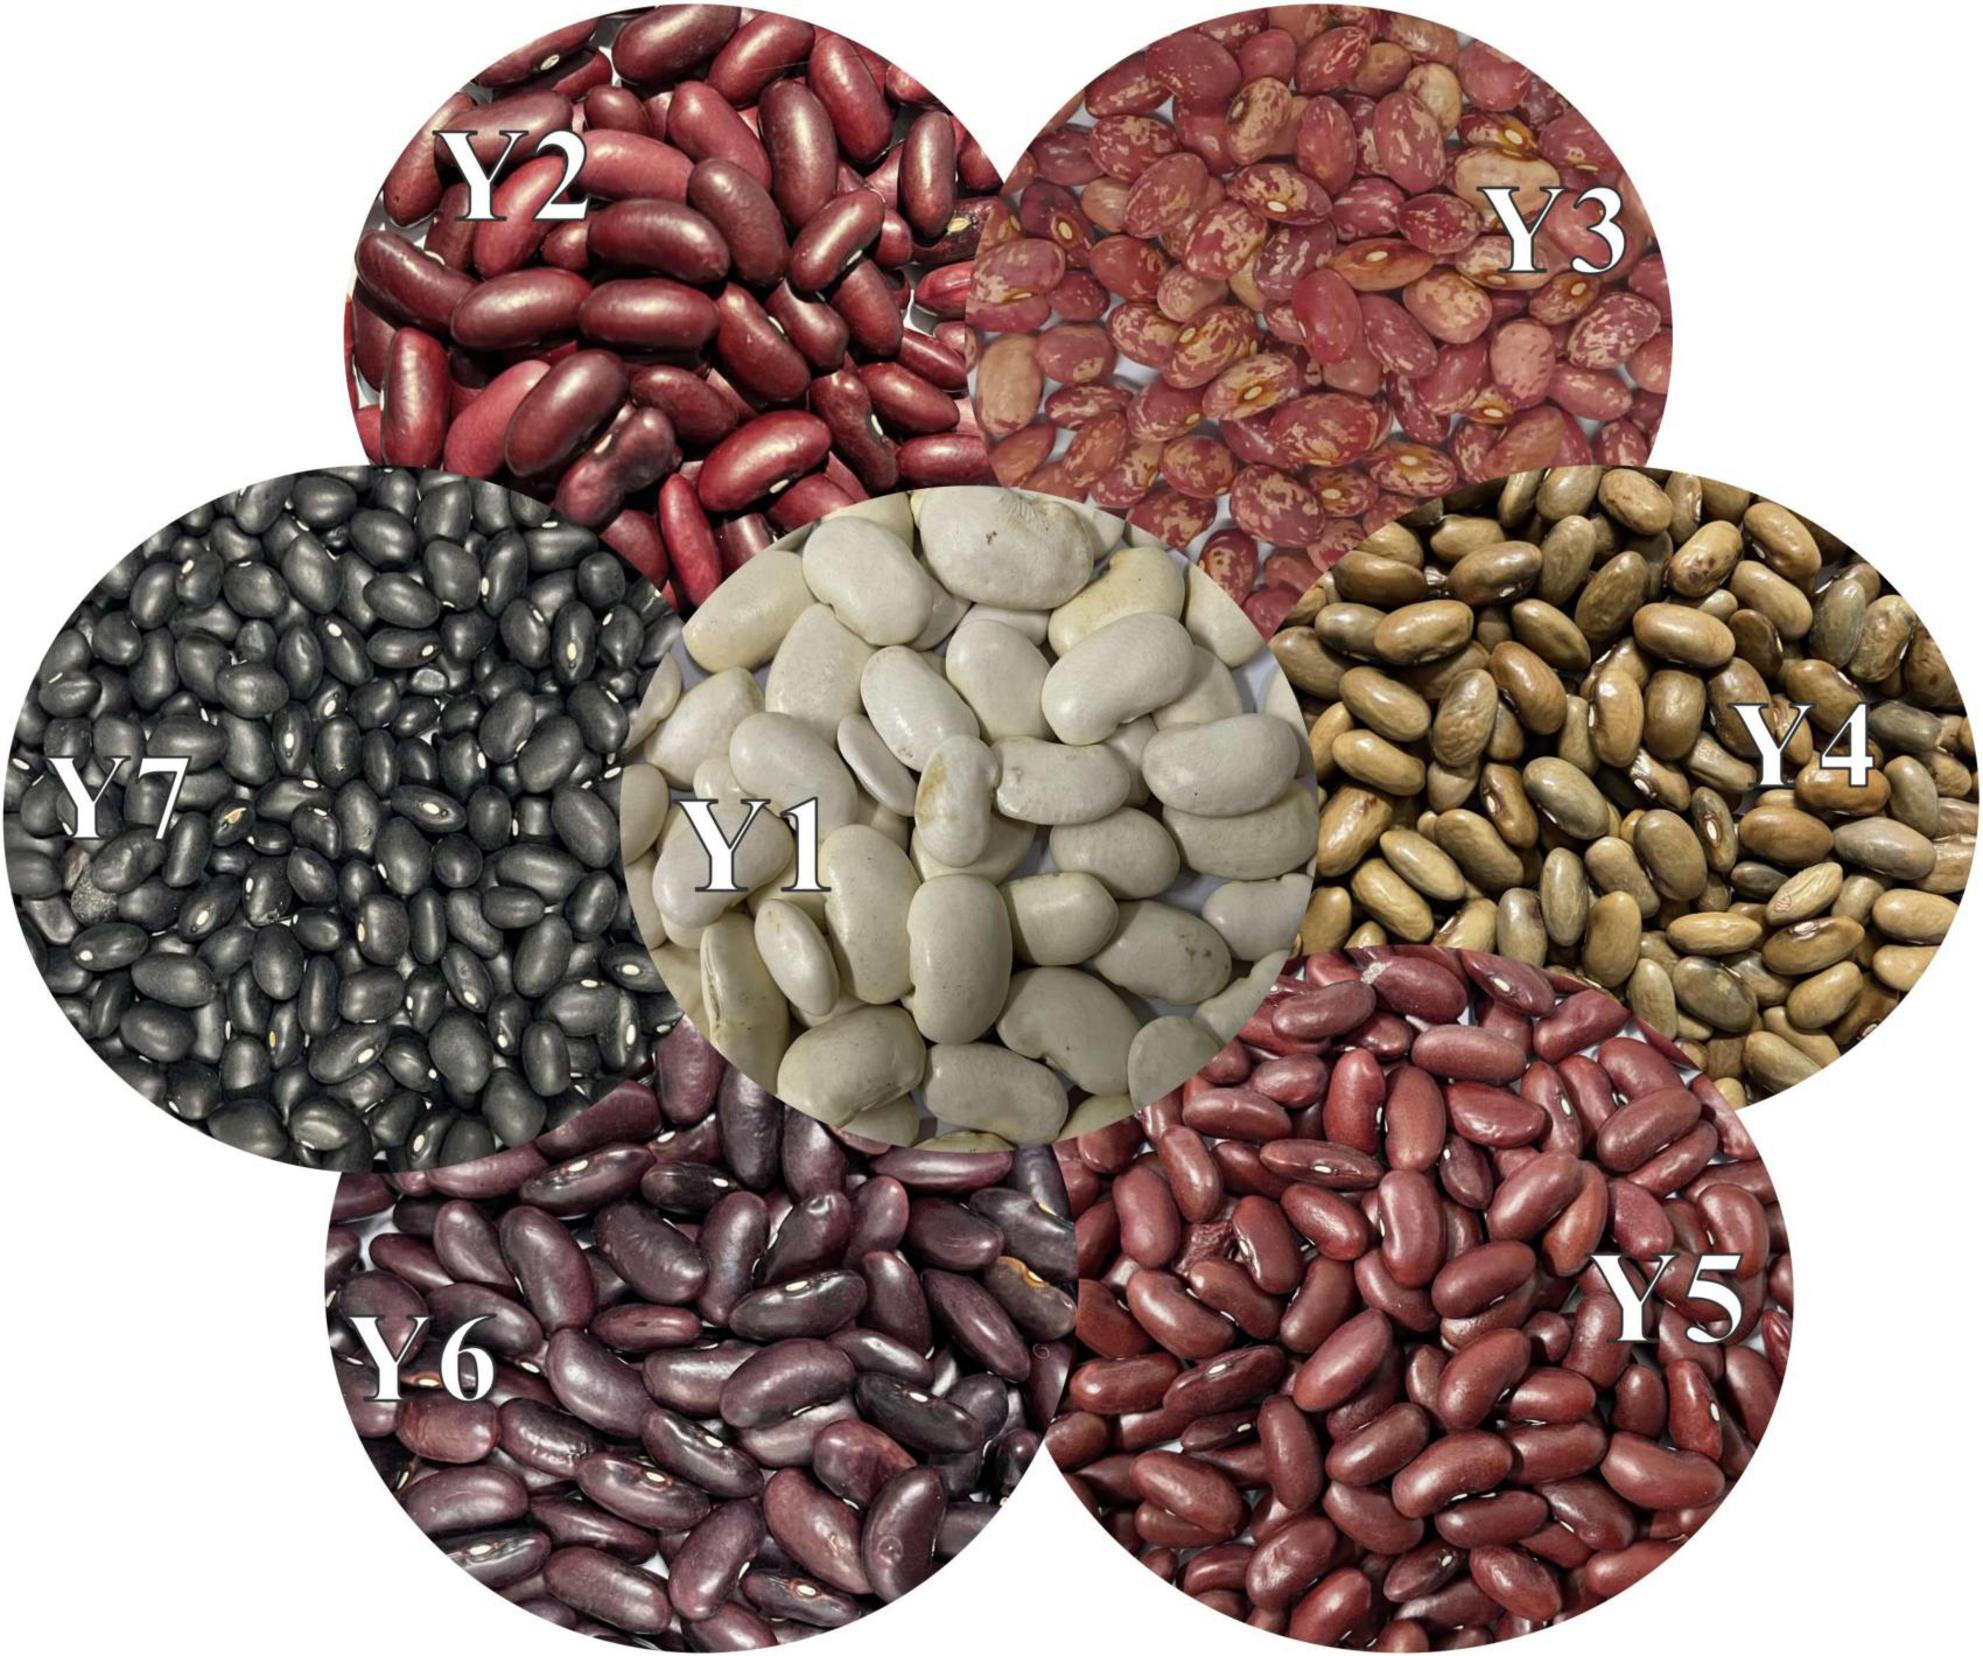
Figure 1. Seven varieties of kidney beans.
Chemicals
Pepsin (source: gastric mucosa of a pig) and gallic acid were purchased from Sigma-Aldrich Ltd (St. Louis, Mo, USA). 3, 5-Dinitrosalicylic acid (DNS) was purchased from Sinopharm Chemical Reagent Co., Ltd (Shanghai, China). Acetone and sodium carbonate were purchased from Chuandong Co., Ltd (Chongqing, China). HPLC-grade acetonitrile and acetic acid were purchased from Aladdin company (Shanghai, China). Glucose was purchased from Yong Zhu Da Chemical Reagent Co., Ltd (Tianjin China). Rutin, chlorogenic acid, 2, 3, 4-trihydroxybenzoic acid, p-hydroxybenzoic acid, catechin and ferulic acid were purchased from Macklin Bioch. Co., Ltd (Shanghai, China). Folin-Ciocalteu’s phenol reagent and the α-amylase enzyme (type: pancreatic, source: bacillus) were purchased from Solarbio Science & Tech. Co., Ltd (Beijing China). Other reagents were purchased from Chengdu Jinshan Chemical Reagent Co., Ltd (Chengdu, China).
Extraction of phenolics
Four grams kidney bean powder was extracted using 15 mL 80% chilled acetone for 15 min, the centrifugation (8,000 g, 5 min) (CenLee16R, Hunan Cenlee Scientific Instrument Co., Ltd., Hunan, China) was performed prior to collecting supernatant, and residues were extracted twice according to the above procedure. The supernatant was evaporated to 5 mL using a rotary evaporator at 45°C, and the volume was then constituted to 10 mL with deionized water. Lastly, the extract was stored in a refrigerator at −20°C for subsequent experiments (20). Each kidney bean powder was extracted in triplicate.
Determination of total phenolics
The total phenolics was determined by referring to previous studies (20, 21). A 100 μL amount of the diluted extract (or gallic acid standard) was pipetted into a 10 mL test tube, then, 400 μL of deionized water and 100 μL of Folin’s phenol reagent were added into the tube prior to a 6-min static reaction (at room temperature). The mixture was then mixed with 1 mL of seven percent sodium carbonate solution and 0.8 mL of deionized water, and the reaction continued for 90 min under dark conditions. Next, 200 μL of the reaction solution was pipetted into 96-well microplates and measured at 760 nm. The standard curve was produced by plotting the standard concentration and absorbance. The total phenolics of the kidney bean extract was calculated from the standard curve and expressed as the milligram gallic acid equivalents per 100 grams dry weight of the kidney bean (mg GAE/100 g DW).
Determination of total flavonoids
The total flavonoids was determined using the aluminum salt method (20). A 0.5 mL amount of extract (or rutin standard) was pipetted into a 10 mL test tube followed by 2.25 mL of deionized water and 0.15 mL of 5% sodium nitrite solution addition. After a 6 min reaction, 0.3 mL of 10% AlCl3.6H2O solution was added, and the solution was reacted for 5 min. Then, 1 mL of 1 mol/L NaOH solution was mixed prior to reacting for 15 min. Finally, 200 μL of reaction solution was pipetted into the 96-well microplates, and a microplate reader (SPECTRA MAX 190, Molecular Devices, Silicon Valley, America) was used to measure the absorbance at 510 nm. The standard curve was plotted from the standard concentration and the corresponding absorbance, and the total flavonoids in the kidney bean extract was calculated from the standard curve and expressed as milligram rutin equivalents per 100 grams dry weight of the kidney bean (mg RE/100 g DW).
Determination of phenolic compounds composition
The phenolic compounds composition was determined using HPLC (20, 22). An Agilent Technologies 1260 Infinity system coupled with an Agilent ZORBBAX-C18 column (250 mm × 4.6 mm, 5 μm) were employed. A 1 mL amount of extract was pipetted into brown autosampler vials after being filtered through a 0.45 μm membrane. Acetonitrile and a 1% glacial acetic acid solution were employed as mobile phases A and B, respectively. The following gradient elution program was adopted: 0–5 min, 5–15% A; 5–35 min, 15–35% A; 35–40 min, 35–45% A; 40–50 min, and 45–5% A. The injection volume was 20 μL, the flow rate was 1.0 mL per minute, and the column temperature was 30°C. An ultraviolet absorption detector was used to detect individual phenolic compounds at 280 nm. The standard curves of the individual phenolic compounds were plotted from the concentrations and corresponding peak areas, and the peaks were identified using the retention time and quantified from the corresponding standard curve. The contents of individual phenolic compounds were expressed as milligram per 100 grams dry weight of the kidney beans (mg/100 g DW).
Determination of α-amylase inhibitor activity
A mixture of kidney bean powder (4 g) and 20 mL of deionized water was reacted in an oscillating water bath (TS-100C, TENSUC, Shanghai, China) at 25°C for 2 h. Then, the supernatant was collected via centrifugation (8,000 g, 4°C, 30 min) (CenLee16R, Hunan Cenlee Scientific Instrument Co., Ltd., Hunan, China), and the volume was subsequently constituted to 20 mL using deionized water. The water extract was immediately subjected to α-AI activity analysis. Each of the kidney beans powder was extracted in triplicate (4).
The α-AI activity was determined according to the method described by previous studies (4, 13) with minor modifications. The water extract was properly diluted to keep the inhibition rate (IR) of α-amylase below 50%. A mixture comprising 0.25 mL of the diluted water extract, 0.25 mL of α-amylase solution (1 U/mL) and 0.5 mL of PBS (pH 6.9) was reacted in an oscillating water bath at 37°C for 10 min. Then, 0.5 mL 1% (W/W) soluble starch solution was added, and a 5 min reaction was allowed in an oscillating water bath at 37°C. Prior to being heated in a boiling water bath, 1 mL DNS solution was added into the mixture, then it was cooled in a cold water bath, the mixture volume was eventually constituted to 20 mL using deionized water, the absorbance of the mixture was measured at 540 nm using an ultraviolet spectrophotometer (L5S, Shanghai yidian analytical instrument co. LTD, Shanghai, China). The following groups that were subjected to no water extract, neither water extract nor α-amylase solution and no α-amylase solution–were regarded as the blank, blank control, and inhibitory control groups, respectively. The IR of α-AI to α-amylase was calculated using the following formula:
where A1 represents the absorbance of the blank group, A2 represents the absorbance of the blank control group, A3 represents the absorbance of the experimental group, and A4 represents the absorbance of the inhibitory control group.
The amount of α-amylase that catalyzed the formation of 1 mol glucose per minute at 37°C with a pH of 6.9 was quantified as an activity unit (U). The quantity of α-AI that inhibited the catalyzing of 1 mol glucose formation per minute in the α-amylase catalytic starch hydrolysis reaction at 37°C with a pH of 6.9 was quantified as an activity unit (U). α-AI-specific activity (U/g) was defined as the α-AI activity unit in one gram of kidney bean and was calculated according to the following formula:
where 1 is the activity of the α-amylase solution (U/mL), n represents the dilution times of water extract, V represents the total volume of the water extract (mL), and m represents the mass of the kidney bean powder (g).
Determination of total starch
The total starch (TS) in the kidney beans was determined according to the National Food Safety Standards of China, GB 5009.9 (23). The kidney bean powder underwent a dual extraction procedure to remove fat and soluble sugar in triplicate, and the residues were then subjected to continuous processes that include gelatinization, saccharification, acid hydrolysis, and neutralization prior to glucose content determination via the alkaline copper tartrate solution titration method.
In vitro simulated digestion
An aliquot of kidney bean powder containing 50 mg of starch was mixed with 2 mL of deionized water, and the mixture was subsequently heated in a boiling water bath (10 min) to gelatinize the starch. Then, it was cooled to room temperature prior to being mixed with 10 mL of HCl-KCl buffer (0.1 mol/L, pH = 1.5) and 0.2 of mL pepsin solution (1 mg/mL) in an oscillating water bath (40°C, 1 h) (TS-100C, TENSUC, Shanghai, China). The digestive mixture was then treated with 15 mL of PBS buffer (pH = 6.9) and 5 mL of α-amylase (2.6 U) to carry out the 180 min enzymatic digestion in an oscillating water bath at 37°C. The aliquots (1 mL) of mixture that have been digested within 0, 20, and 120 min were used to determine the starch properties (24, 25), and the other aliquots of mixture that have been digested within 0, 30, 60, 90, 120, 150, and 180 min were used for glycemic index determination. Reference substance (white bread) was subjected to the above procedure except the gelatinization process, and tests were performed in triplicate (4, 26). The aliquots of the digested mixture were boiled to inactivate enzyme activities and subsequently cooled using a cold water bath. The supernatant was then collected via centrifugation (8,000 g, 4°C, 10 min) (CenLee16R, Hunan Cenlee Scientific Instrument Co., Ltd., Hunan, China) and eventually subjected to glucose content determination. The above procedures were performed on the kidney bean powder in triplicate.
Determination of glucose content
The DNS colorimetry was adopted to determine the glucose content (27). The mixture consisted of 0.2 mL of supernatant and 0.2 mL of DNS solution was boiled for 6 min in a water bath and subsequently cooled to room temperature with running water. The volume of the reaction mixture was constituted to 2 mL using deionized water, and the absorbance of the mixture was eventually measured using a spectrophotometer (L5S, Shanghai yidian analytical instrument co. LTD, Shanghai, China) at 540 nm.
Calculation of starch composition
The contents of rapidly digestible starch (RDS), slowly digestible starch (SDS) and resistant starch (RS) were calculated by referring to the previous studies (24, 25). The following equations were used:
where C0 is the free glucose concentration before the enzymatic hydrolysis (mg/mL), C20 is the concentration of glucose released within 20 min (mg/mL), C120 is the concentration of glucose released within 120 min (mg/mL), V is the initial volume (mL) of the enzymatic hydrolysis reaction system, 0.9 is the conversion factor of glucose to starch, and 50 is the starch content (mg) in the measured sample.
Calculation of glycemic index
The glycemic index of kidney bean was calculated by referring the previous studies (4, 26, 28). The digestion time (min) and starch hydrolysis rate (SR) were employed as the abscissa and the ordinate, respectively, to plot the starch hydrolysis curve. The SR was calculated using the following equation:
where Ct is the glucose content at time t (min) of the enzymatic hydrolysis, C0 is the glucose content at the beginning (0 min) of the enzymatic hydrolysis, V is the initial volume (mL) of the enzymatic hydrolysis reaction system, 0.9 is the conversion factor of glucose to starch, and 50 is the starch content (mg) in the measured sample. The kinetic constant (K) and the maximum glucose content (C∞) (mg/mL) were calculated from the following equation:
where C∞ represents the maximum glucose content (mg/mL), and K represents the kinetic constant. The area under the hydrolysis curve (AUC) was calculated using the following equation:
where tf represents the end of the enzymatic hydrolysis reaction (180 min), and t0 represents the beginning of the enzymatic hydrolysis reaction (0 min). The glycemic index (GI) was calculated from the following equation:
where calcHI is the starch hydrolysis index, which calculated from AUCsample/AUC white bread.
Statistical analysis
The means ± standard deviation (SD) in triplicate were presented to illustrate the data, ANOVA and Tukey’s test (IBM SPSS Statistics 20) were adopted to analyze the data. Origin 2018 (Origin Lab Corporation, USA) was employed to plot the figures, the significant differences were identified at the p < 0.05 and p < 0.01 levels.
Results and discussion
Total phenolics, total flavonoids, and phenolics profile of kidney beans
Phenolic acids, flavonoids, and anthocyanins are phytochemicals that possess phenolic hydroxyl groups in their molecular structure and provide positive effects on reducing the risk of chronic diseases, including cancer and type II diabetes (29, 30). In the present study, the moisture content of kidney beans was 15.04 ± 0.54% (Y1), 12.94 ± 0.37% (Y2), 13.47 ± 0.45% (Y3), 12.21 ± 0.11% (Y4), 13.80 ± 0.17% (Y5), 12.91 ± 0.11% (Y6), and 14.09 ± 0.69% (Y7), respectively; the total phenolics of the kidney beans ranged from 59.86 ± 2.04 to 579.80 ± 7.96 mg GAE/100 g DW, and the total flavonoids of the kidney beans ranged from 86.16 ± 3.11 to 1008.69 ± 4.50 mg RE/100 g DW, these results were similar to those of mung beans reported by the previous study of which the total phenolics ranged from 1.86 ± 0.01 to 5.07 ± 0.08 mg GAE/g, and total flavonoids ranged from 1.81 ± 0.08 to 5.97 ± 0.23 mg RE/g (31). Y7—black color—presented the highest total phenolics and the second highest total flavonoids. Y3—speckled color—presented the highest total flavonoids and the second highest total phenolics. Y1—white color—presented the lowest total phenolics and total flavonoids. Additionally, Y2, Y4, Y5, and Y6 were claret-colored, greenish brown, red, and atropurpureus-colored, respectively, which presented modest total phenolics and total flavonoids, as shown in Table 1. The regularity of the relations between color and total phenolics and total flavonoids were similar with the previous studies which suggested that the total phenolics and total flavonoids of dark-colored (red, black, and speckled) beans were higher than the white ones (32, 33). Anthocyanins belong to flavonoids, which are the dominant substance appearing various colors, non-white bean coats contained more anthocyanins than the white ones (34). And anthocyanin is constituted by flavonoids with saccharide groups and characterized by the C ring carbon attached to the B ring (35). The substitution pattern of the B ring affects the chromatic features of anthocyanin (36). These phenolics were considered as inhibitor to restrain α-amylase and α-glucosidase (11).
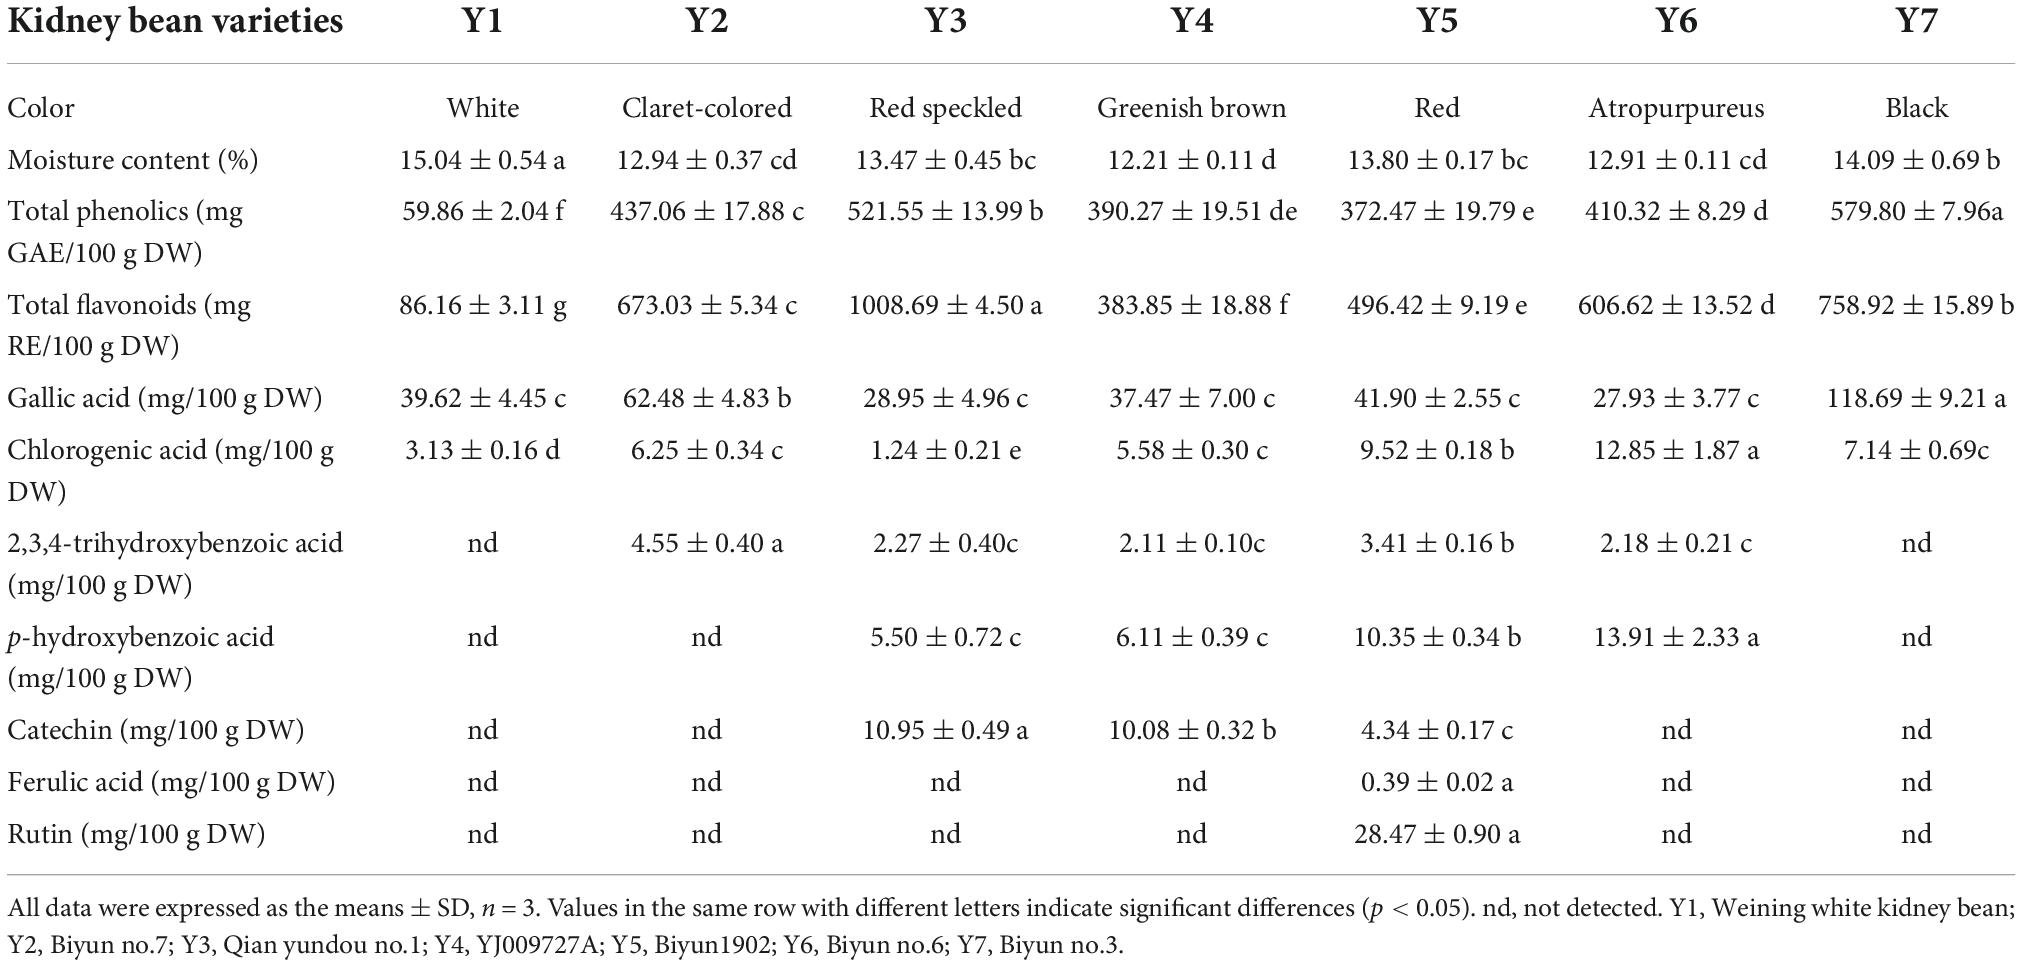
Table 1. Moisture content and phenolic compounds composition of kidney beans.
The individual phenolic compounds of the kidney bean were determined as well. Gallic acid was the most prevalent phenolic compound that ranged from 27.93 ± 3.77 to 118.69 ± 9.21 mg/100 g DW, and Y7 presented the highest content. Chlorogenic acid, 2, 3, 4-trihydroxybenzoic acid, p-hydroxybenzoic acid and catechin were minor phenolic compounds found in kidney beans. Ferulic acid (0.39 ± 0.02 mg/100 g DW) and rutin (28.47 ± 0.90 mg/100 g DW) were only present in Y5, as shown in Table 1. Previous studies have shown that gallic acid, ferulic acid, catechin, and rutin were present in beans, with gallic acid being the major compound (8, 37, 38). The content of ferulic acid, catechin and p-hydroxybenzoic acid in the present research were higher than those in lentils reported by Zhang (10). Chlorogenic acid is an ester of quinic acid and caffeic acid (39), which may reduce the risk of cardiovascular diseases, obesity and diabetes by lowering reactive oxygen species (35, 40). Moreover, phenolics possess the potential in dietary strategies via the inhibition of α-amylase activity. It has been proposed that phenolics bind to α-amylase through non-covalent interactions such as hydrogen bonds or hydrophobic interactions to form soluble or insoluble polyphenol-protein aggregates, leading to the denaturation or inactivation of α-amylase (41).
Alpha-amylase inhibitor activity of kidney beans
The hydrolytic catalysis of α-amylase on the internal α-1,4 glycosidic bond of the molecular chains in starch is critical for starch hydrolysis (42), which results in the hydrolysis of starch into maltose and other oligosaccharides that are further hydrolyzed into glucose by α-glucosidases, eventually, it is absorbed by the gut (43). α-AI is a glycoprotein that inhibits α-amylase activity, resulting in a lower glycemic index (13). The α-AI specific activities of the kidney beans ranged from 1.659 ± 0.050 to 4.162 ± 0.049 U/g DW, Y2 showed the highest activity, followed by Y1, Y6, Y4, Y5, Y7, and Y3, respectively (Figure 2). Beans are an abundant source of α-AI (44, 45). Zhang et al. investigated the α-AI activity in beans (lentil) and found the inhibition concentration of 50% ranged from 23.08 to 42.15 mg/mL in α-amylase (10); moreover, the α-AI-specific activity of rice beans ranged from 7.529 to 10.766 U/g (46). These acquired results of α-AI activity indicate that beans possess potential for use in dietary strategy.
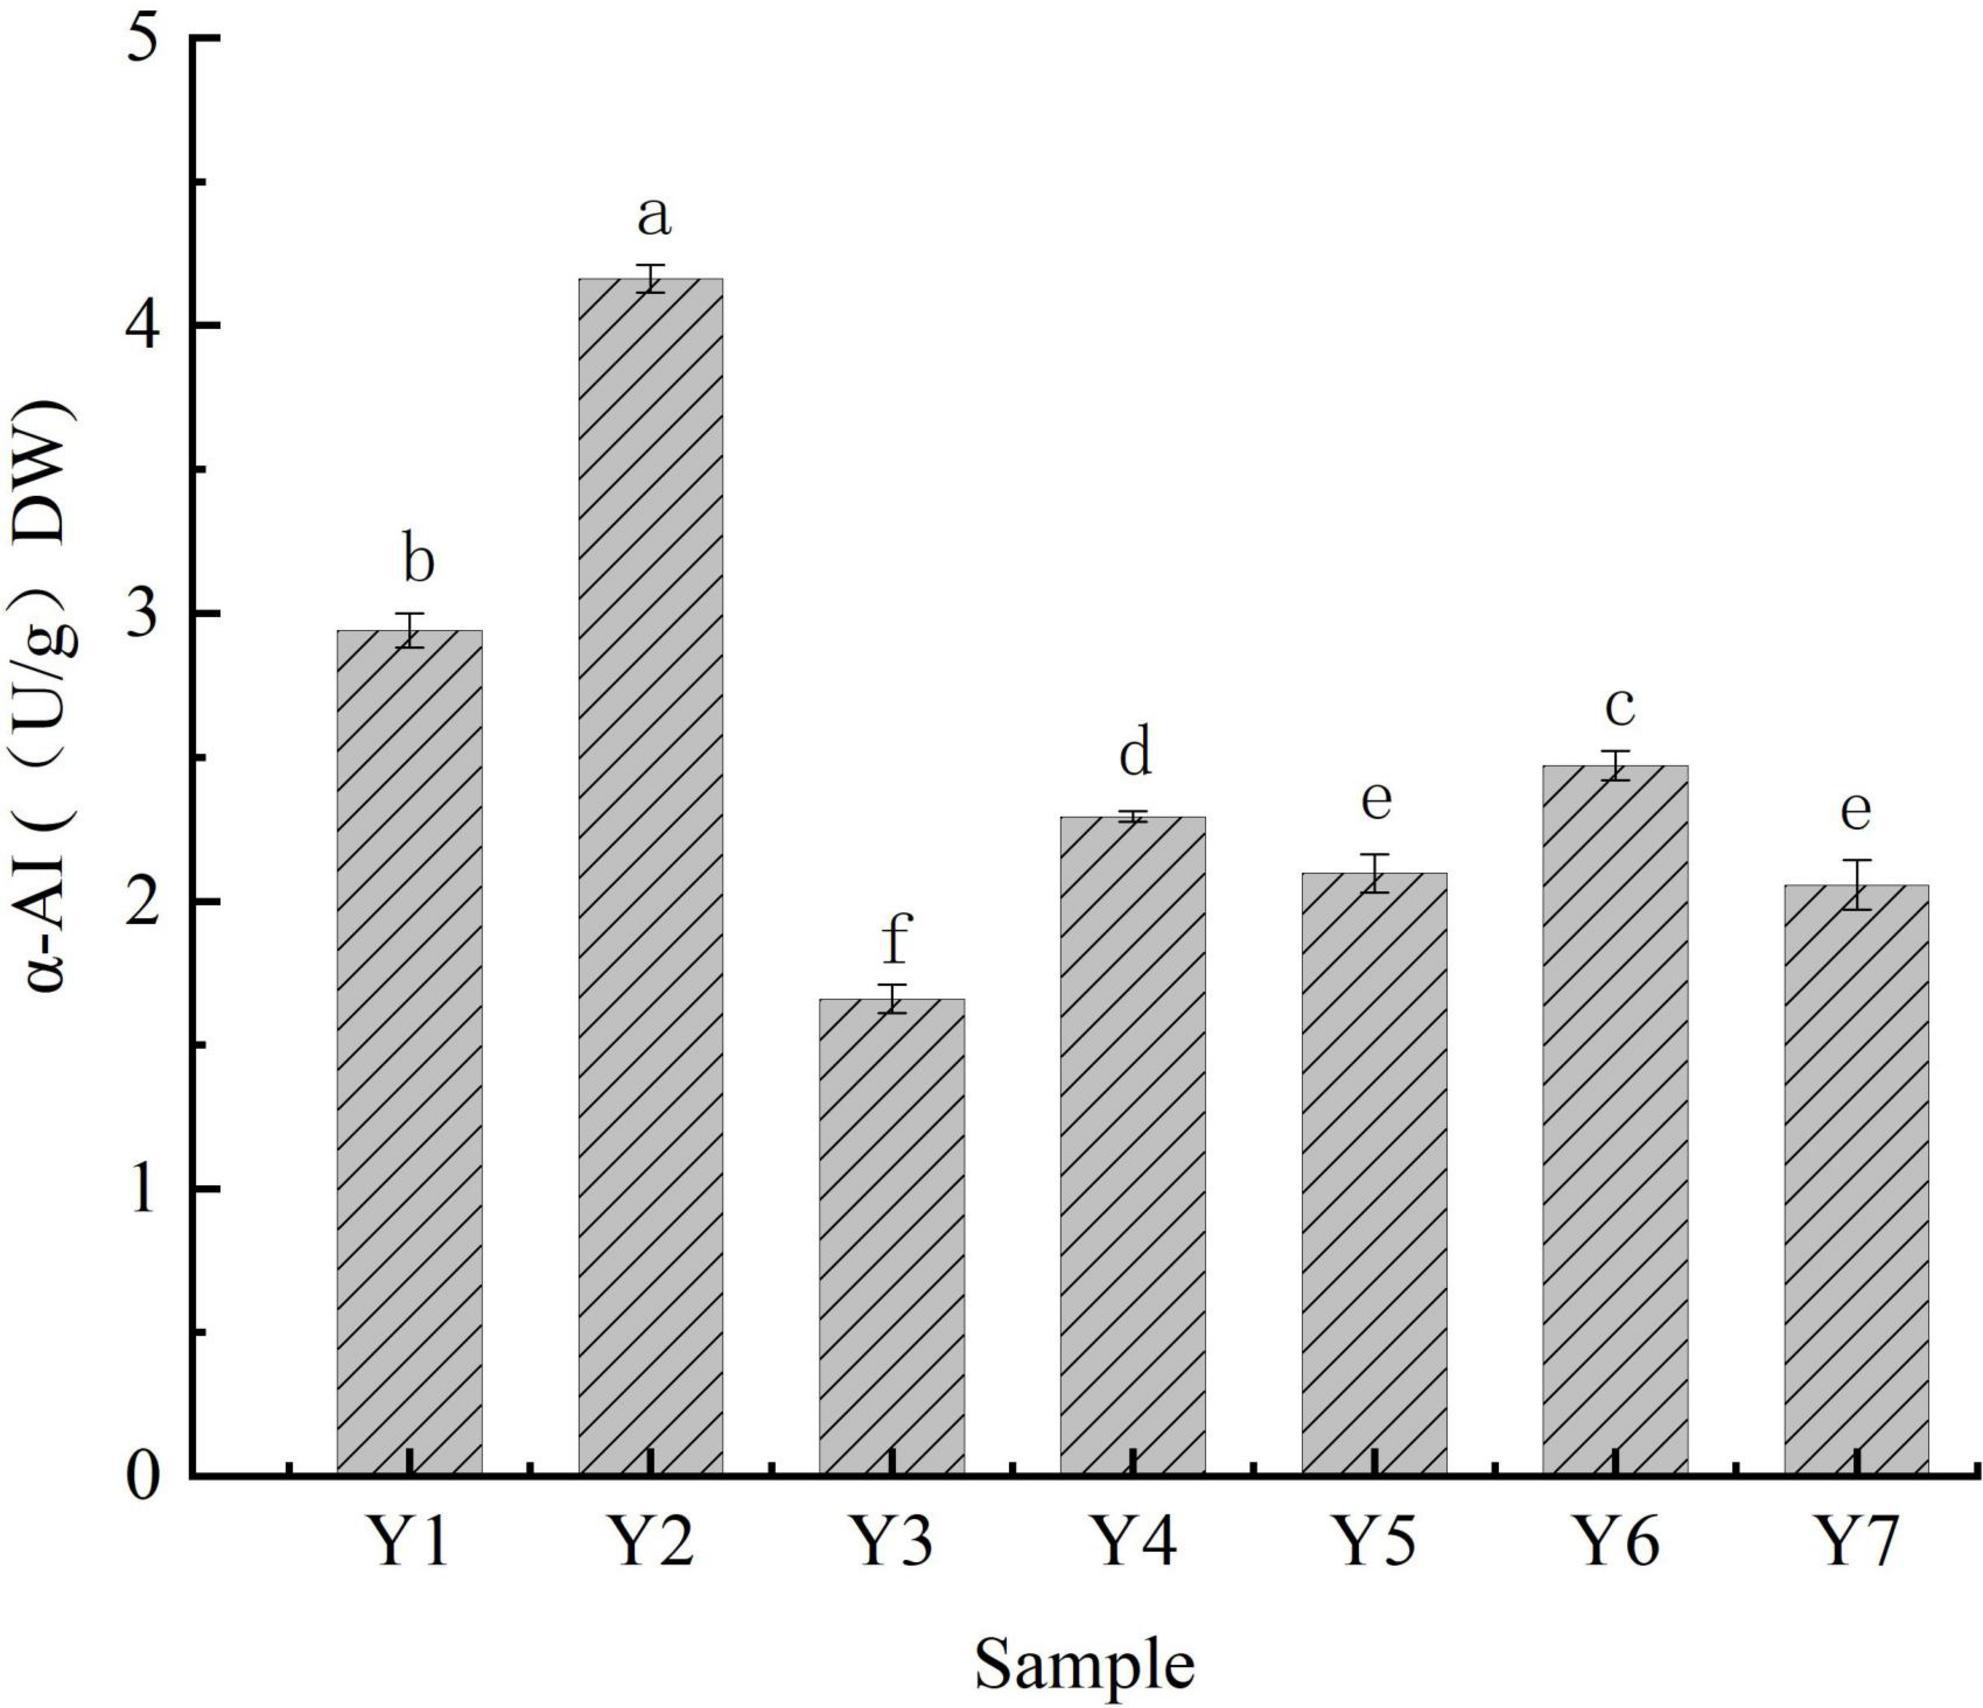
Figure 2. α-AI-specific activities of kidney beans. Bars with different letters indicate significant differences (p < 0.05).
Starch composition of kidney beans
Starch can be divided into rapidly digestible starch (RDS), slowly digestible starch (SDS) and resistant starch (RS). RDS can be digested within 20 min, SDS can be digested between 20 and 120 min, and RS cannot be digested even after 120 min (25). Compared to RDS, SDS is slowly digested in the digestion system; hence, it keeps stable in the gastrointestinal tract for a longer time and presents minor effects on the stimulation of postprandial insulin-secretion, which maintains the function and sensitivity of insulin, avoiding metabolic syndromes such as hyperinsulinemia and insulin resistance (47, 48). In addition, RS cannot be digested in the small intestine and widely be regarded as a beneficial carbohydrate, especially for glycemic control (47, 49, 50). In the present study, the contribution of starch content to the dry weight of the kidney beans ranged from 28.66 ± 0.37 to 37.98 ± 1.44%, RDS, SDS and RS contributed to the total starch content ranged from 7.80 ± 0.35 to 13.67 ± 0.26%, 5.73 ± 0.41 to 16.31 ± 0.45%, and 70.90 ± 0.39 to 83.12 ± 0.42%, respectively, as shown in Table 2. These results indicated that kidney beans may possess potential for use in glycemic control.
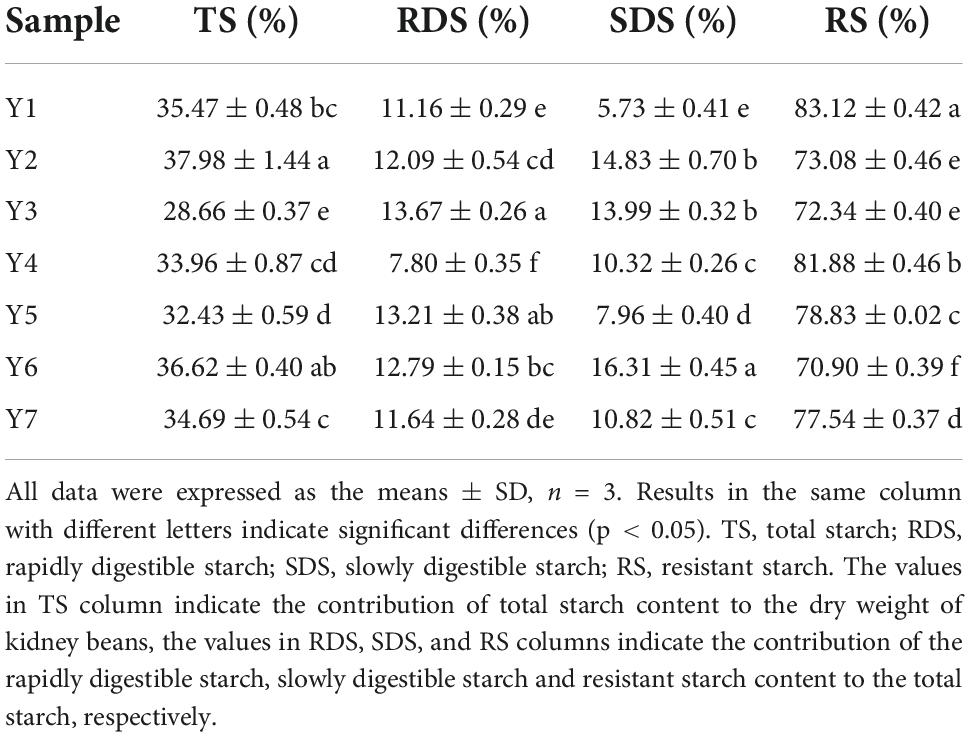
Table 2. Starch components of kidney beans.
Glycemic index of kidney beans
Glycemic index (GI) was computed in accordance with the ratio of blood glucose elevating effects of a food to the reference substance, which reflects the blood glucose levels after ingestion of a food (4, 5). The GI of foods can be categorized as three level: low (≤55), medium (55 < GI ≤ 70) and high (>70) (16, 51).
In the present study, the GI was implemented in an in vitro digestion model coupled with the DNS colorimetry method. Starch hydrolysis curves were plotted according to the SR and hydrolysis time, as shown in Figure 3. The SR of kidney beans was significantly lower than that of white bread (reference). The SR of Y2 was 26.41 ± 0.41% at the end of the digestion period (180 min), followed by Y6, Y3, Y7, and Y5. Y1 and Y4 presented a lower SR, with the values of 12.47 ± 0.45% and 12.37 ± 0.20%, respectively. The kidney beans could be categorized into three groups according to their GIs: Y1, Y4, and Y5 were less than 40 (32.47 ± 0.13–37.66 ± 0.64); Y2 and Y7 were less than 50 (42.87 ± 0.58–49.18 ± 0.42), and Y3 and Y6 were less than 55 (52.48 ± 0.53–52.99 ± 0.56), Y4 had the lowest GI amongst these kidney beans, with the value of 32.47 ± 0.13, as shown in Table 3. The GI of other beans has been evaluated in previous studies, in which the values ranged from 12.00 ± 0.10 to 57.59 ± 3.41 (7, 12, 16, 52–54). Additionally, the RS content manifests extremely negative correlation with the GI (p < 0.01, r = 0.974), which suggested that the RS makes a dominant contribution to the low GI in kidney beans, this may be due to the RS compositions—insoluble, soluble dietary fiber, and non-digestible oligosaccharides—which cannot be digested in the small intestine (55). These ingredients confer kidney beans with excellent glucose-lowering potential. In the present study, the GI range of kidney beans was 32.47 ± 0.13 ∼ 52.99 ± 0.56 which indicated that they can be categorized into low GI and served as ingredients in functional low GI foods.
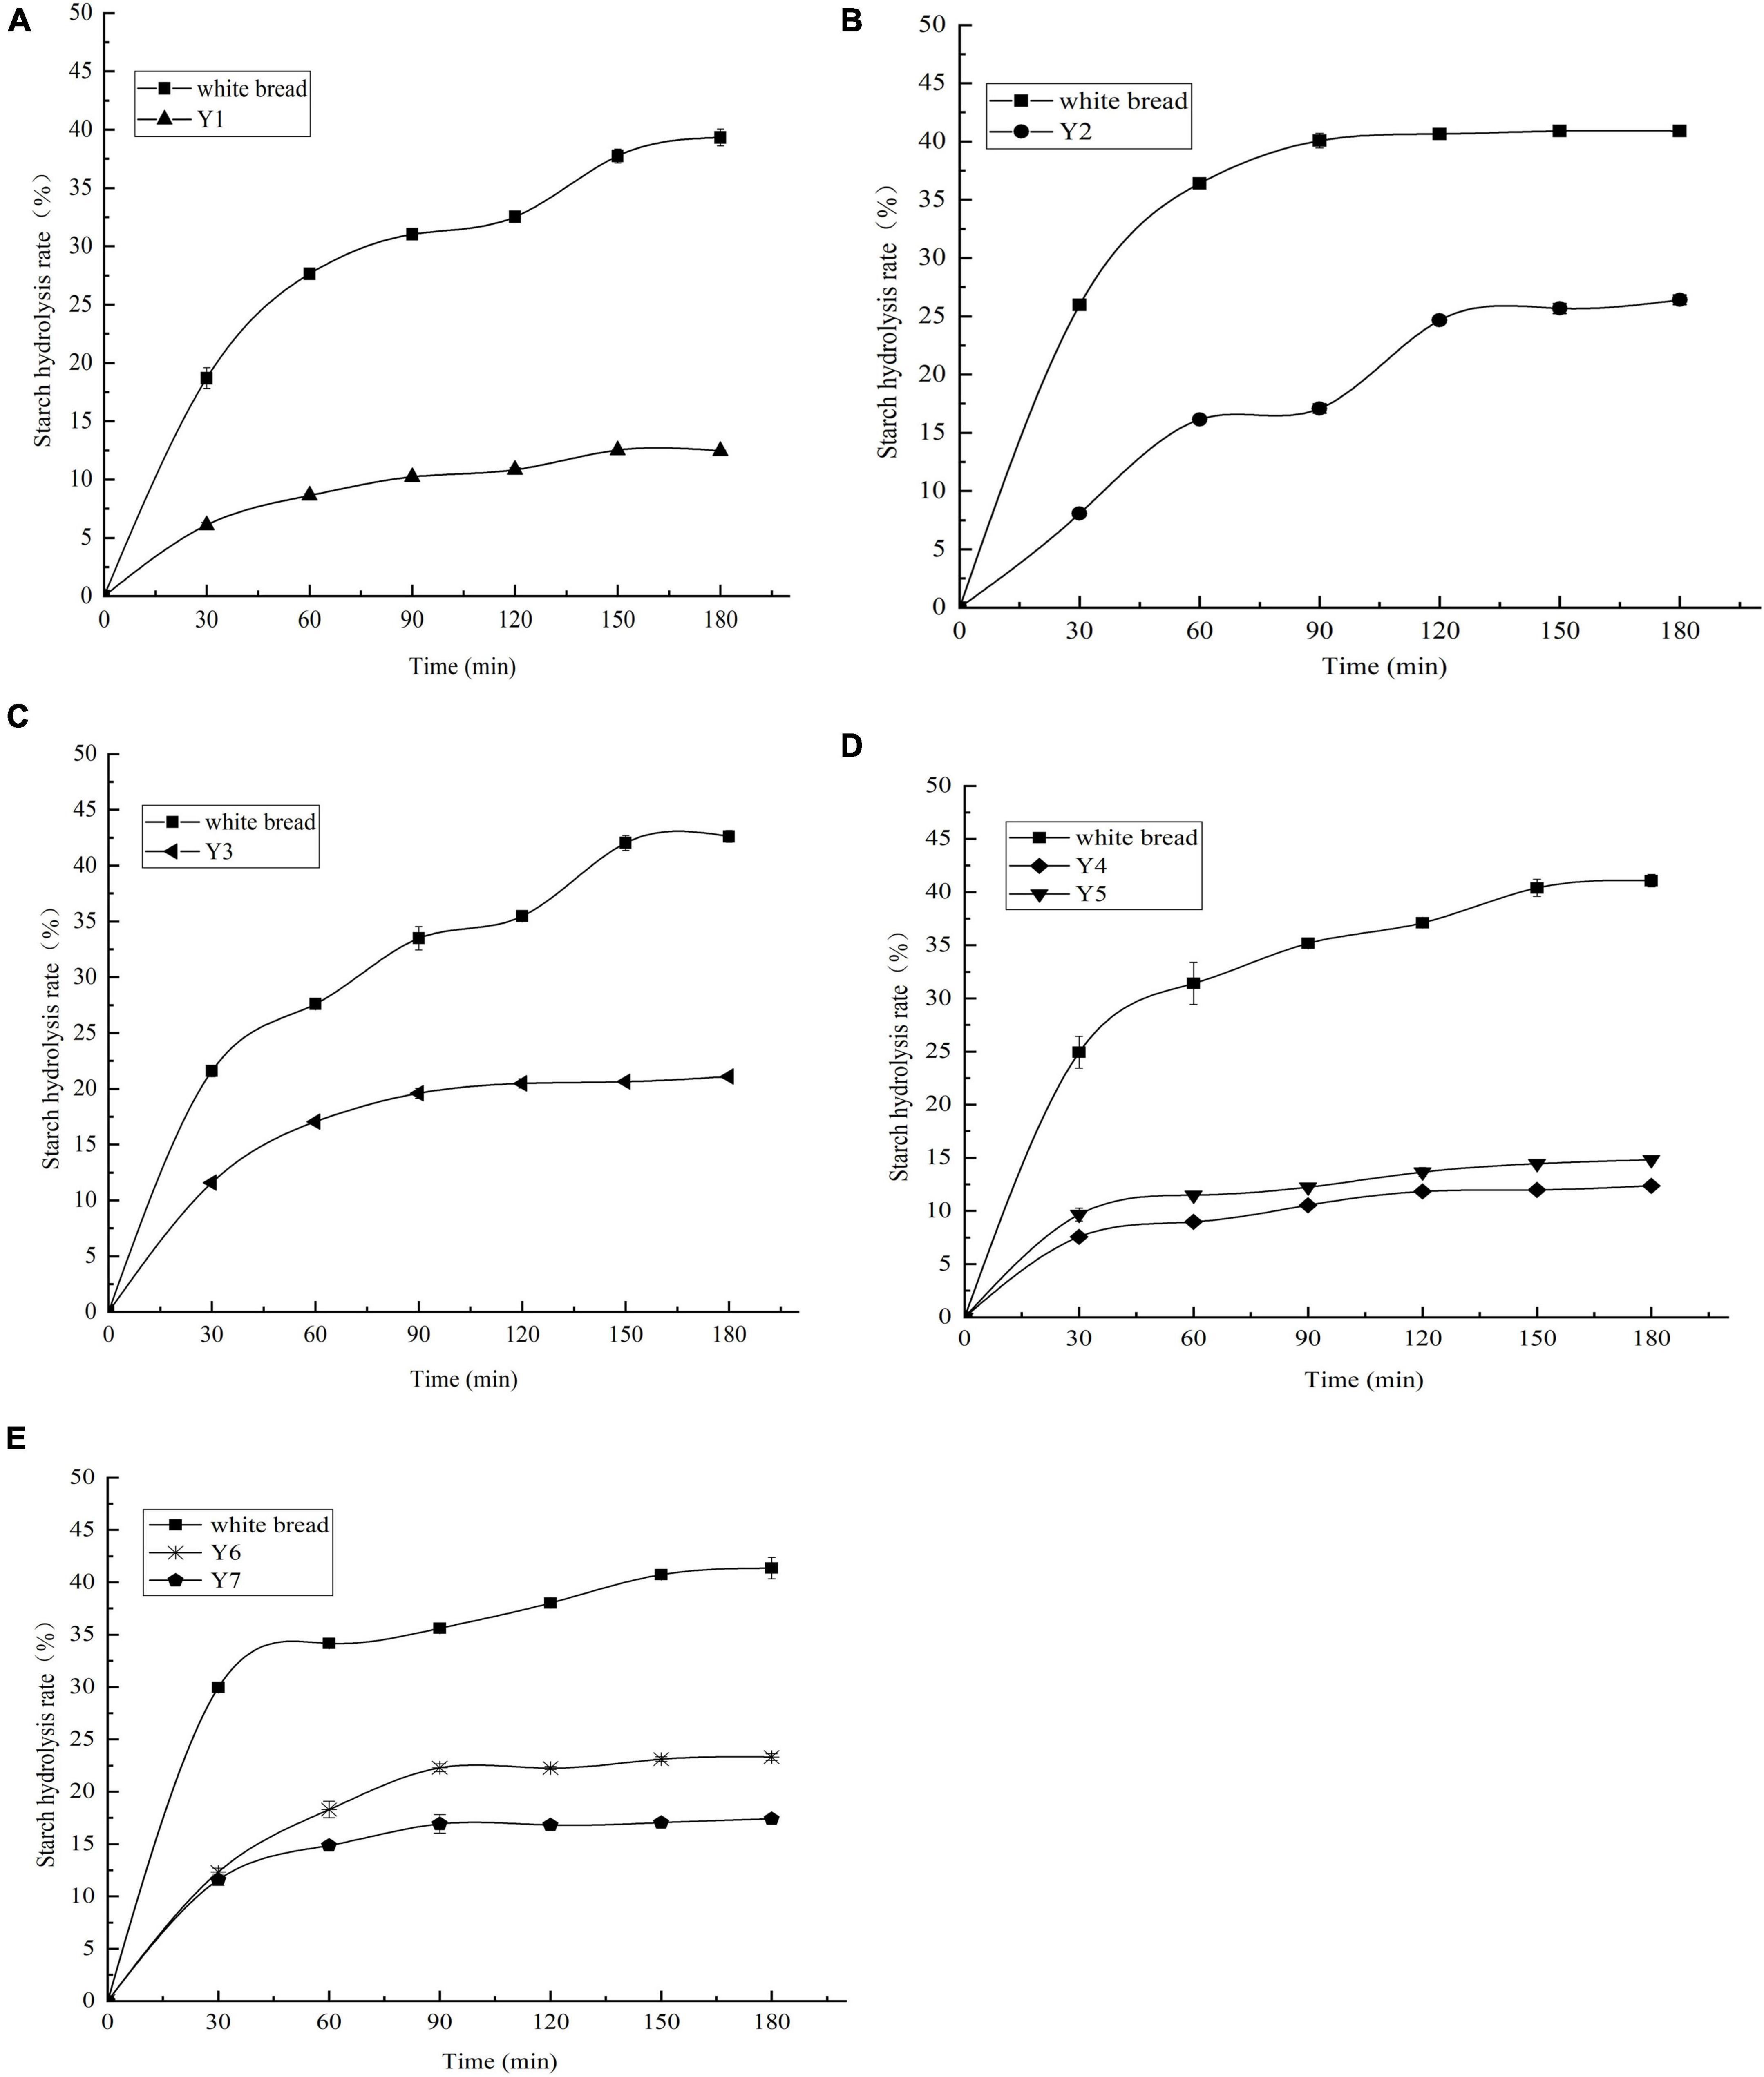
Figure 3. (A–E) Starch hydrolysis curves of kidney beans and white bread. Y1, Weining white kidney bean; Y2, Biyun no.7; Y3, Qian yundou no.1; Y4, YJ009727A; Y5, Biyun1902; Y6, Biyun no.6; Y7, Biyun no.3.
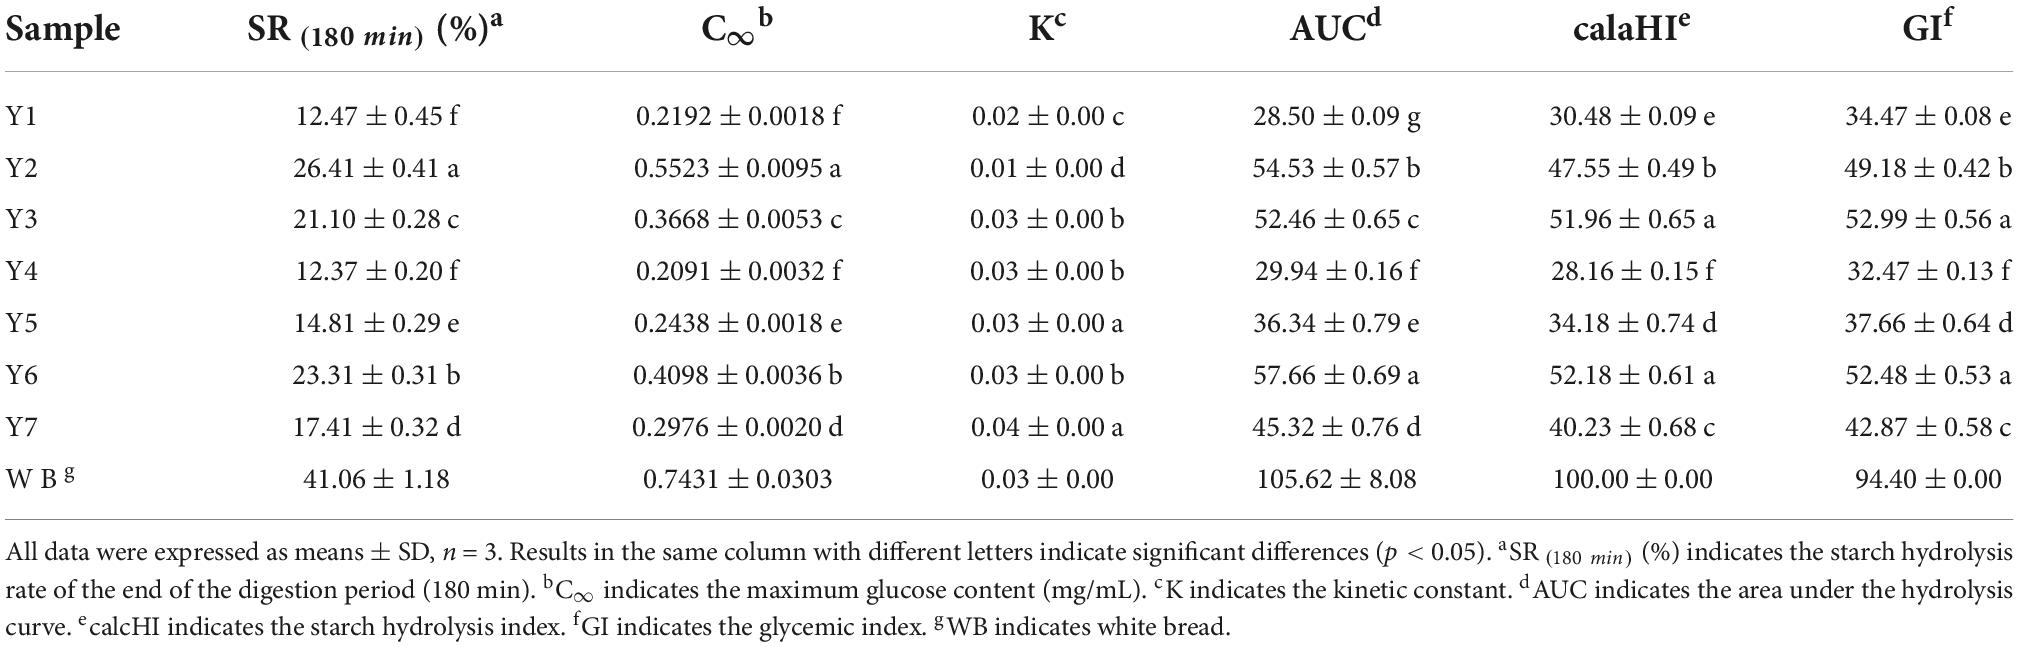
Table 3. Glycemic index (GI) and related indexes of kidney beans.
Conclusion
After thorough evaluation of the functional components profile and the potential blood glucose response of kidney beans, it is determined that these kidney beans contain abundant phenolic compounds, in which the phenolics and flavonoids content of dark-colored beans (red, black, and speckled) are higher than the white ones. Gallic acid is the most prevalent phenolic compound, of which the highest content is present in black kidney bean. In addition, these kidney beans which are prone to inhibit α-amylase activity and show resistant properties during the digestion can be categorized as low GI foods. RS makes the dominant contribution to the low GI of kidney beans. The three kidney beans—greenish brown, white, and red—should be emphasized as their GIs present less than 40. These results indicate that kidney beans can be served as ingredients in functional low GI foods for the dietary regulation of type II diabetes patients.
Data availability statement
The original contributions presented in this study are included in the article/Supplementary material, further inquiries can be directed to the corresponding author.
Author contributions
YZ: conceptualization, methodology, supervision, and project administration. YZ and SX: validation, data curation, writing—original draft preparation and review and editing, and visualization. SX and MM: formal analysis. YZ, SX, and LQ: investigation. YZ and LQ: resources and funding acquisition. All authors have read and agreed to the published version of the manuscript.
Funding
This research was financially supported by Guizhou Science and Technology Program [Qian Ke He Ji Chu (2019)1071, Qian Ke He Zhi Cheng (2020)1Y171, Qian Ke He Ping Tai Ren Cai (2018) 5254, (2018) 5781, Qian Ke He Zhi Cheng (2022) zhongdian 007, Qian Ke He Zhi Cheng (2021) yiban 175], Establishment of Guizhou Modern Agriculture Industry Technical System (Characteristic Coarse Cereals) Qian Cai Nong (2018)81.
Acknowledgments
We are grateful to Guizhou Bijie Institute of Agricultural Sciences of China for providing experimental materials.
Conflict of interest
The authors declare that the research was conducted in the absence of any commercial or financial relationships that could be construed as a potential conflict of interest.
Publisher’s note
All claims expressed in this article are solely those of the authors and do not necessarily represent those of their affiliated organizations, or those of the publisher, the editors and the reviewers. Any product that may be evaluated in this article, or claim that may be made by its manufacturer, is not guaranteed or endorsed by the publisher.
Supplementary material
The Supplementary Material for this article can be found online at: https://www.frontiersin.org/articles/10.3389/fnut.2022.1044427/full#supplementary-material
Abbreviations
GI, glycemic index; α-AI, α-amylase inhibitor; TS, total starch; RDS, rapidly digestible starch; SDS, slowly digestible starch; RS, resistant starch; DNS, 3, 5-dinitrosalicylic acid.
References
1. Kwon YI, Apostolidis E, Kim YC, Shetty K. Health benefits of traditional corn, beans, and pumpkin: in vitro studies for hyperglycemia and hypertension management. J Med Food. (2007) 10:266–75. doi: 10.1089/jmf.2006.234
2. Maritim AC, Sanders RA, Watkins JB. Diabetes, oxidative stress, and antioxidants: a review. J Biochem Mol Toxicol. (2003) 17:24–38. doi: 10.1002/jbt.10058
3. Modi P. Benefits of low glycemic and high satiety index foods for obesity and diabetes control and management. In: Gerald JK, Watson RR, Preedy VR editors. Nutrients, Dietary Supplements, and Nutriceuticals. Totowa, NJ: Humana Press (2011). p. 403–24.
4. Ma Y, Rang Y, Yang R, Zhao W. Effect of white kidney bean extracts on estimated glycemic index of different kinds of porridge. LWT Food Sci Technol. (2018) 96:576–82. doi: 10.1016/j.lwt.2018.06.018
5. Udani JK, Singh BB, Barrett ML, Preuss HG. Lowering the glycemic index of white bread using a white bean extract. Nutr J. (2009) 8:52. doi: 10.1186/1475-2891-8-52
6. Kumar G, Xu B. Polyphenol-rich dry common beans (Phaseolus vulgaris L.) and their health benefits. Int J Mol Sci. (2017) 18:2331. doi: 10.3390/ijms18112331
7. Chung H, Liu Q, Pauls KP, Fan MZ, Yada R. In vitro starch digestibility, expected glycemic index and some physicochemical properties of starch and flour from common bean (Phaseolus vulgaris L.) varieties grown in Canada. Food Res Int. (2008) 41:869–75. doi: 10.1016/j.foodres.2008.03.013
8. Damián-Medina K, Salinas-Moreno Y, Milenkovic D, Figueroa-Yáñez L, Marino-Marmolejo E, Higuera-Ciapara I, et al. In silico analysis of antidiabetic potential of phenolic compounds from blue corn (Zea mays L.) and black bean (Phaseolus vulgaris L.). Heliyon. (2020) 6:e03632. doi: 10.1016/j.heliyon.2020.e03632
9. Yang Q, Gan R, Ge Y, Zhang D, Corke H. Polyphenols in common beans (Phaseolus vulgaris L.): chemistry, analysis, and factors affecting composition. Compr Rev Food Sci Food Saf. (2018) 17:1518–39. doi: 10.1111/1541-4337.12391
10. Zhang B, Deng Z, Ramdath DD, Yao T, Chen PX, Liu R, et al. Phenolic profiles of 20 Canadian lentil cultivars and their contribution to antioxidant activity and inhibitory effects on α-glucosidase and pancreatic lipase. Food Chem. (2015) 172:862–72. doi: 10.1016/j.foodchem.2014.09.144
11. Zheng Y, Liu S, Xie J, Xie J, Hu X, Yu Q. Antioxidant, α-amylase and α-glucosidase inhibitory activities of bound polyphenols extracted from mung bean skin dietary fiber. LWT Food Sci Technol. (2020) 132:109943. doi: 10.1016/j.lwt.2020.109943
12. Chinedum E, Sanni S, Theressa N, Ebere A. Effect of domestic cooking on the starch digestibility, predicted glycemic indices, polyphenol contents and alpha amylase inhibitory properties of beans (Phaseolis vulgaris) and breadfruit (Treculia africana). Int J Biol Macromol. (2018) 106:200–6. doi: 10.1016/j.ijbiomac.2017.08.005
13. Yang MY, Zhang XQ, Ma Y, Shen J, Song JR, Zhu HL. Purification and partial characterization of a glycoprotein alpha-amylase inhibitor from white kidney bean (Phaseolus vulgaris. L). J Food Biochem. (2008) 32:72–84. doi: 10.1111/j.1745-4514.2007.00147.x
14. Yao Y, Hu Y, Zhu Y, Gao Y, Ren G. Comparisons of phaseolin type and α-amylase inhibitor in common bean (Phaseolus vulgaris L.) in China. Crop J. (2016) 4:68–72. doi: 10.1016/j.cj.2015.09.002
15. Shi Z, Zhu Y, Teng C, Yao Y, Ren G, Richel A. Anti-obesity effects of alpha-amylase inhibitor enriched-extract from white common beans (Phaseolus vulgaris L.) associated with the modulation of gut microbiota composition in high-fat diet-induced obese rats. Food Funct. (2020) 11:1624–34. doi: 10.1039/c9fo01813a
16. Afandi FA, Wijaya CH, Faridah DN, Suyatma NE, Jayanegara A. Evaluation of various starchy foods: a systematic review and meta-analysis on chemical properties affecting the glycemic index values based on in vitro and in vivo experiments. Foods. (2021) 10:364. doi: 10.3390/foods10020364
17. Zhao T, Sun L, Wang Z, Nisar T, Gong T, Li D, et al. The antioxidant property and α-amylase inhibition activity of young apple polyphenols are related with apple varieties. LWT Food Sci Technol. (2019) 111:252–9. doi: 10.1016/j.lwt.2019.05.006
18. Xiong WY, Zhang B, Dhital SS, Huang Q, Fu X. Structural features and starch digestion properties of intact pulse cotyledon cells modified by heat-moisture treatment. J Funct Foods. (2019) 61:103500. doi: 10.1016/j.jff.2019.103500
19. Nizam U, Hasan MR, Hossain MM, Arjyabrata S, Hasan AHMN, Islam AFMM, et al. In vitro α-amylase inhibitory activity and in vivo hypoglycemic effect of methanol extract of Citrus macroptera Montr. fruit. Asian Pac J Trop Biomed. (2014) 4:473–9. doi: 10.12980/APJTB.4.2014C1173
20. Chen Y, Qin L, Wen A, Mazhar M, Wang H, Zhu Y. Three-solvent extracting method comprehensively evaluates phenolics profile and antioxidant activities of Tartary buckwheat. J Food Process Preserv. (2021) 45:e15020. doi: 10.1111/jfpp.15020
21. Alara OR, Mudalip SKA, Abdurahman NH, Mahmoud MS, Obanijesu EO. Data on parametric influence of microwave-assisted extraction on the recovery yield, total phenolic content and antioxidant activity of Phaleria macrocarpa fruit peel extract. Chem Data Collect. (2019) 24:100277. doi: 10.1016/j.cdc.2019.100277
22. Zhu Y, Li T, Fu X, Abbasi AM, Zheng B, Liu RH. Phenolics content, antioxidant and antiproliferative activities of dehulled highland barley (Hordeum vulgare L.). J Funct Foods. (2015) 19:439–50. doi: 10.1016/j.jff.2015.09.053
23. National Health And Family Planning Commission of the People’s Republic of China, State Food And Drug Administration. National standards of the People’s Republic of China Method for the Determination of Starch in Food In: GB/5009.9-2016 GB/5009.9-2016. Beijing: China Standard Press (2016).
24. Wu X, Yu H, Bao G, Luan M, Wang C. Preparation of adzuki bean starch-lipid complexes and their anti-digestion mechanism. J Food Meas Charact. (2022) 16:945–56. doi: 10.1007/s11694-021-01222-z
25. Li Y, Xiao J, Tu J, Yu L, Niu L. Matcha-fortified rice noodles: Characteristics of in vitro starch digestibility, antioxidant and eating quality. LWT Food Sci Technol. (2021) 149:111852. doi: 10.1016/j.lwt.2021.111852
26. Ferrer-Mairal A, Peñalva-Lapuente C, Iglesia I, Urtasun L, De Miguel-Etayo P, Remón S, et al. In vitro and in vivo assessment of the glycemic index of bakery products: influence of the reformulation of ingredients. Eur J Nutr. (2012) 51:947–54. doi: 10.1007/s00394-011-0272-6
27. Toutounji MR, Leeuwen MV, Oliver JD, Shrestha AK, Castignolles P, Gaborieau M. Quantification of sugars in breakfast cereals using capillary electrophoresis. Carbohyd Res. (2015) 408:134–41. doi: 10.1016/j.carres.2015.03.008
28. Goñi I, Garcia-Alonso A, Saura-Calixto F. A starch hydrolysis procedure to estimate glycemic index. Nutr Res. (1997) 17:427–37. doi: 10.1016/S0271-5317(97)00010-9
29. Zhu Y, Sang S. Phytochemicals in whole grain wheat and their health-promoting effects. Mol Nutr Food Res. (2017) 61:1600852. doi: 10.1002/mnfr.201600852
30. Liu RH. Whole grain phytochemicals and health. J Cereal Sci. (2007) 46:207–19. doi: 10.1016/j.jcs.2007.06.010
31. Zhang X, Shang P, Qin F, Zhou Q, Gao B, Huang H, et al. Chemical composition and antioxidative and anti-inflammatory properties of ten commercial mung bean samples. LWT Food Sci Technol. (2013) 54:171–8. doi: 10.1016/j.lwt.2013.05.034
32. Gan R, Lui W, Corke H. Sword bean (Canavalia gladiata) as a source of antioxidant phenolics. Int J Food Sci Technol. (2016) 51:156–62. doi: 10.1111/ijfs.12979
33. Ombra MN, D’Acierno A, Nazzaro F, Riccardi R, Spigno P, Zaccardelli M, et al. Phenolic composition and antioxidant and antiproliferative activities of the extracts of twelve common bean (Phaseolus vulgaris L.) endemic ecotypes of southern Italy before and after cooking. Oxid Med Cell Longev. (2016) 2016:1398298. doi: 10.1155/2016/1398298
34. Kan L, Nie S, Hu J, Liu Z, Xie M. Antioxidant activities and anthocyanins composition of seed coats from twenty-six kidney bean cultivars. J Funct Foods. (2016) 26:622–31. doi: 10.1016/j.jff.2016.08.030
35. Xie L, Su H, Sun C, Zheng X, Chen W. Recent advances in understanding the anti-obesity activity of anthocyanins and their biosynthesis in microorganisms. Trends Food Sci Technol. (2018) 72:13–24. doi: 10.1016/j.tifs.2017.12.002
36. Manach C, Scalbert A, Morand C, Remesy C, Jimenez L. Polyphenols: food sources and bioavailability. Am J Clin Nutr. (2004) 79:727–47. doi: 10.1093/ajcn/79.5.727
37. Amarowicz R, Shahidi F. Antioxidant activity of broad bean seed extract and its phenolic composition. J Funct Foods. (2017) 38:656–62. doi: 10.1016/j.jff.2017.04.002
38. Wang Y, Zhang X, Chen G, Yu J, Yang L, Gao Y. Antioxidant property and their free, soluble conjugate and insoluble-bound phenolic contents in selected beans. J Funct Foods. (2016) 24:359–72. doi: 10.1016/j.jff.2016.04.026
39. Tarasiuk A, Fichna J. Effectiveness and therapeutic value of phytochemicals in acute pancreatitis: a review. Pancreatology. (2019) 19:481–7. doi: 10.1016/j.pan.2019.04.010
40. Jung HJ, Im SS, Song DK, Bae JH. Effects of chlorogenic acid on intracellular calcium regulation in lysophosphatidylcholine-treated endothelial cells. BMB Rep. (2017) 50:323–8. doi: 10.5483/bmbrep.2017.50.6.182
41. Bandyopadhyay P, Ghosh AK, Ghosh C. Recent developments on polyphenol-protein interactions: effects on tea and coffee taste, antioxidant properties and the digestive system. Food Funct. (2012) 3:592–605. doi: 10.1039/c2fo00006g
42. Kandra L. α-Amylases of medical and industrial importance. J Mol Struct (Theochem). (2003) 66:487–98. doi: 10.1016/j.theochem.2003.08.073
43. Mehrabadi M, Bandani AR, Saadati F. Inhibition of Sunn pest, eurygaster integriceps, α-Amylases by α-Amylase inhibitors (α-AI) from triticale. J Insect Sci. (2010) 19:1–13. doi: 10.1673/031.010.14139
44. Habib HM, Theuri SW, Kheadr E, Mohamed FE. DNA, BSA damage inhibitory activities, anti-acetylcholinesterase, anti-porcine α-amylase and antioxidant properties of Dolichos lablab bean. Food Funct. (2016) 8:881–7. doi: 10.1039/c6fo01164k
45. Helmstaedter A. Beans and diabetes: Phaseolus vulgaris preparations as antihyperglycemic agents. J Med Food. (2010) 13:251–4. doi: 10.1089/jmf.2009.0002
46. Katoch R, Jamwal A. Characterization of α-amylase inhibitor from rice bean with inhibitory activity against midgut α-amylases from Spodoptera litura. Appl Biochem Microbiol. (2013) 49:419–25. doi: 10.1134/S0003683813040157
47. Drawbridge PC, Beta T. Chapter 7 resistant and slowly digested starch in grain products. In: Beta T, Camire ME editors. Cereal Grain-Based Functional Foods: Carbohydrate and Phytochemical Components. London: The Royal Society of Chemistry (2019). p. 127–46.
48. Katayama K, Kitahara K, Sakai T, Kai Y, Yoshinaga M. Resistant and digestible starch contents in sweet potato cultivars and lines. J Appl Glyosci. (2011) 58:53–9.
49. Giuberti G, Gallo A. Reducing the glycaemic index and increasing the slowly digestible starch content in gluten−free cereal−based foods: a review. Int J Food Sci Technol. (2018) 53:50–60.
50. Miao M, Jiang B, Cui SW, Zhang T, Jin Z. Slowly digestible starch—a review. Crit Rev Food Sci. (2015) 55:1642–57. doi: 10.1080/10408398.2012.704434
51. Atkinson FS, Brand-Miller JC, Foster-Powell K, Buyken AE, Goletzke J. International tables of glycemic index and glycemic load values 2021: a systematic review. Am J Clin Nutr. (2021) 114:1625–32. doi: 10.1093/ajcn/nqab233
52. Eashwarage IS, Herath HMT, Gunathilake KGT. Dietary fibre, resistant starch and in-vitro starch digestibility of selected elevencommonly consumed legumes (mung bean, cowpea, soybean and horse gram) in Sri Lanka. Res J Chem Sci. (2017) 7:1–7.
53. Sandhu KS, Lim S. Digestibility of legume starches as influenced by their physical and structural properties. Carbohyd Polym. (2008) 71:245–52. doi: 10.1016/j.carbpol.2007.05.036
54. Sáyago-Ayerdi SG, Tovar J, Osorio-Díaz P, Paredes-López O, Bello-Pérez LA. In vitro starch digestibility and predicted glycemic index of corn tortilla, black beans, and tortilla-bean mixture: effect of cold storage. J Agric Food Chem. (2005) 53:1281–5. doi: 10.1021/jf048652k
Keywords: kidney beans, α-amylase inhibitor, resistant starch, glycemic index, type II diabetes
Citation: Xu S, Qin L, Mazhar M and Zhu Y (2022) Functional components profile and glycemic index of kidney beans. Front. Nutr. 9:1044427. doi: 10.3389/fnut.2022.1044427
Received: 14 September 2022; Accepted: 18 October 2022;
Published: 02 November 2022.
Edited by:
Yuyun Lu, National University of Singapore, SingaporeReviewed by:
Yingbin Shen, Guangzhou University, ChinaJunjia Zhang, Rutgers, The State University of New Jersey, United States
Copyright © 2022 Xu, Qin, Mazhar and Zhu. This is an open-access article distributed under the terms of the Creative Commons Attribution License (CC BY). The use, distribution or reproduction in other forums is permitted, provided the original author(s) and the copyright owner(s) are credited and that the original publication in this journal is cited, in accordance with accepted academic practice. No use, distribution or reproduction is permitted which does not comply with these terms.
*Correspondence: Yong Zhu, zhuyonghappycool@163.com, yzhu5@gzu.edu.cn