How can we represent the motion of an object? Consider a car that moves with a constant, rightward (+) velocity.
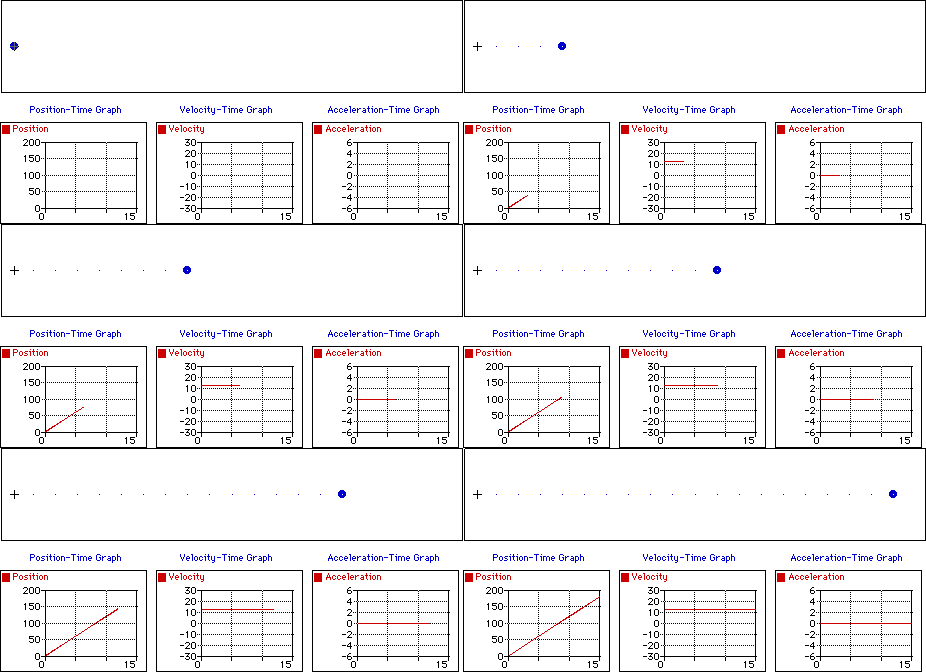
velocity = + 10 m/s
We could show it’s position, as time goes by, like this.

We can also draw this as a distance vs. time graph (D-T.)
This is sometimes called a position-time graph (P-T.)
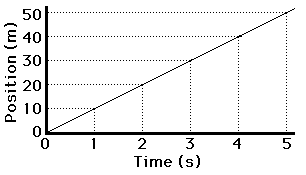
Here we see that motion with constant, positive velocity yields a line of constant, positive slope.
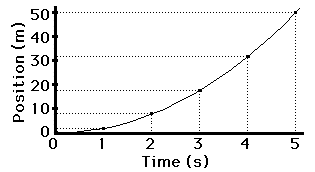
Now consider a car with a rightward (+), changing velocity:
It’s moving rightwards and accelerating.
We could show it’s position, as time goes by, like this.

We can also draw this as a distance vs. time graph (D-T.)
This results in a line of changing, positive slope
Now lets look at these lessons from PhysicsClassroom.
The Meaning of Shape for a P-T graph
Animations of D-T, V-T and A-T graphs
Ticker-tape diagrams
Could be a person, or car, or hawk, moving to the right!
Constant rightward velocity (no acceleration)
————————————————————-
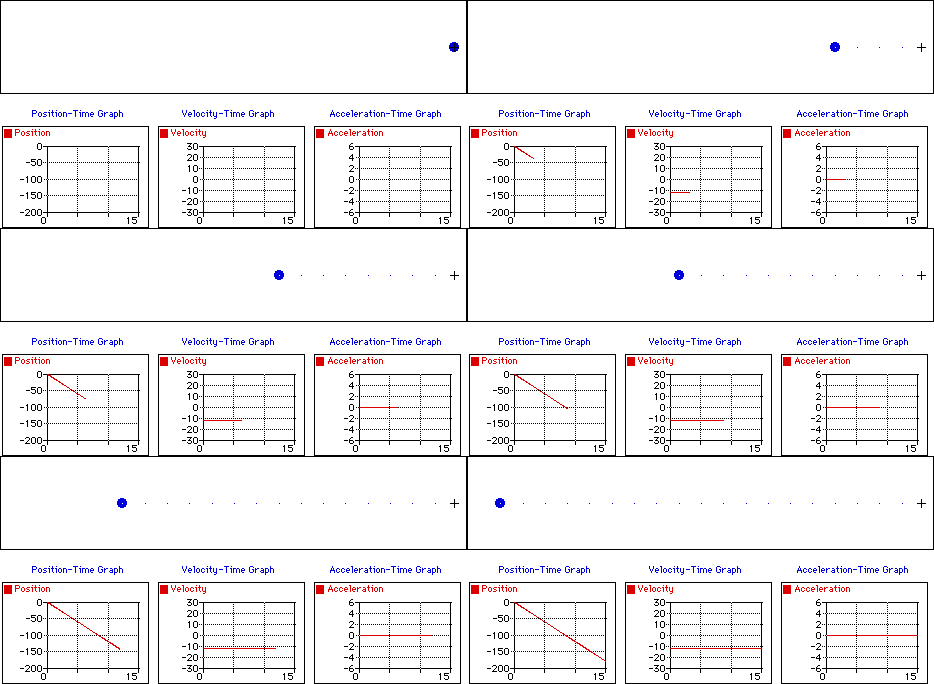
Constant leftward velocity (no acceleration)
What would these look like if we add in acceleration?
When we accelerate, our velocity changes…
-
Leftward Velocity with a Leftward Acceleration
-
Leftward Velocity with a Rightward Acceleration
-
Passing Lane – Position vs. Time Graph
-
Passing Lane – Velocity vs. Time Graph
-
The Stoplight
-
Motion of a Two-Stage Rocket
Now let’s put this all together:
Open these documents (Word, Google Docs)
Distance-time graphs
Determining the Slope on a V-T Graph
Determining the Area on a V-T Graph
More D-T graphs
From PhysicsLab online:
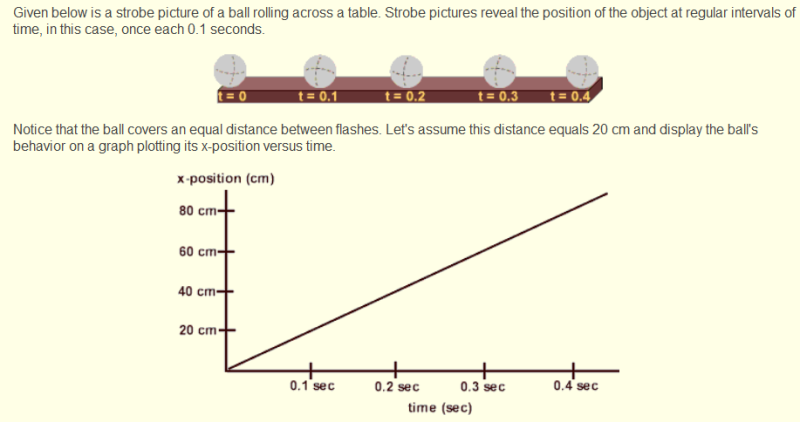
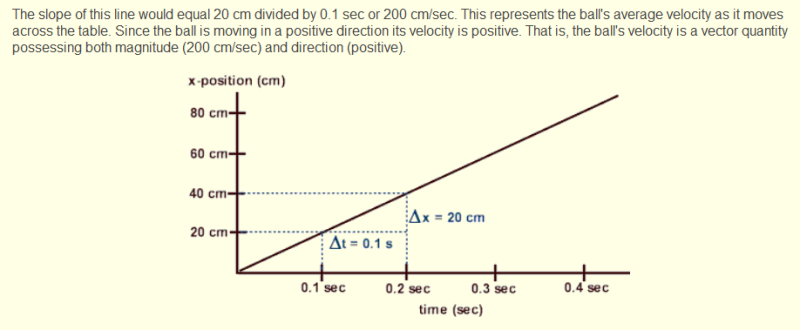
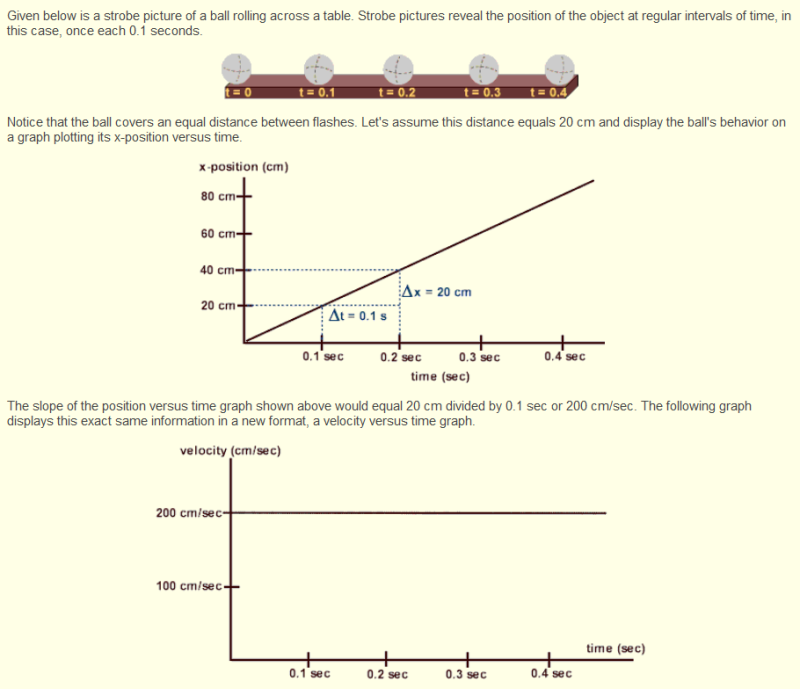
Given below is a strobe picture of a ball rolling across a table.
Strobe pictures reveal the position of the object at regular intervals of time
In this case, once each 0.1 seconds.
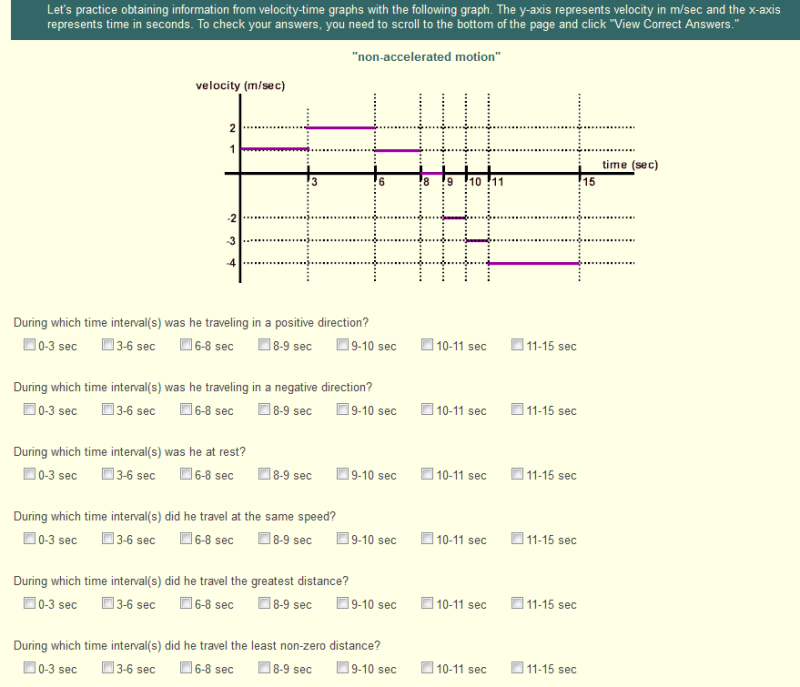
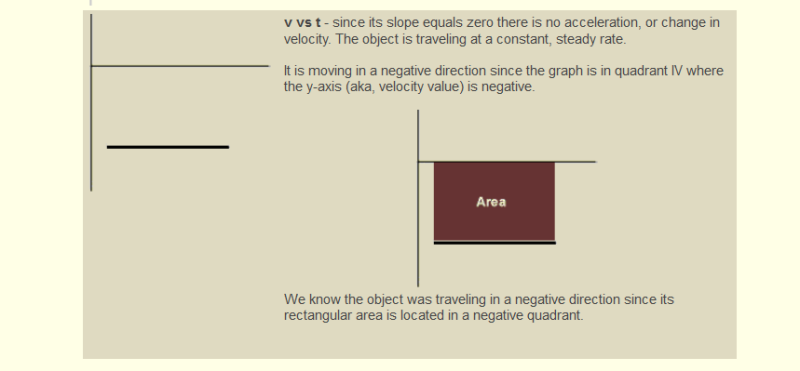
Velocity-Time graphs
from PhysicsLab Online
http://dev.physicslab.org/Document.aspx?doctype=3&filename=Kinematics_VelocityTimeGraphs.xml
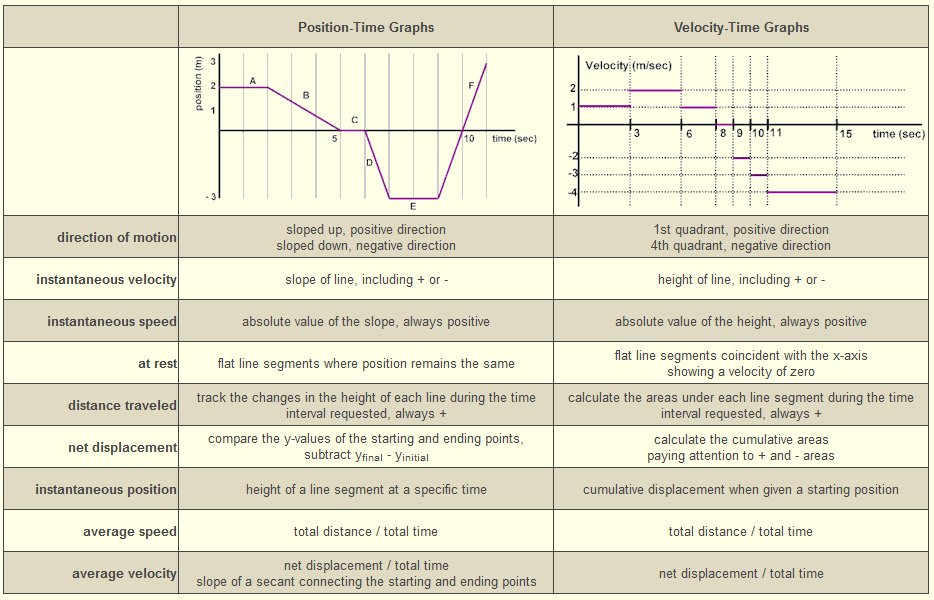
Comparing different types of graphs
The slope of a position-time line is VELOCITY
The slope of an velocity-time line is ACCELERATION
-
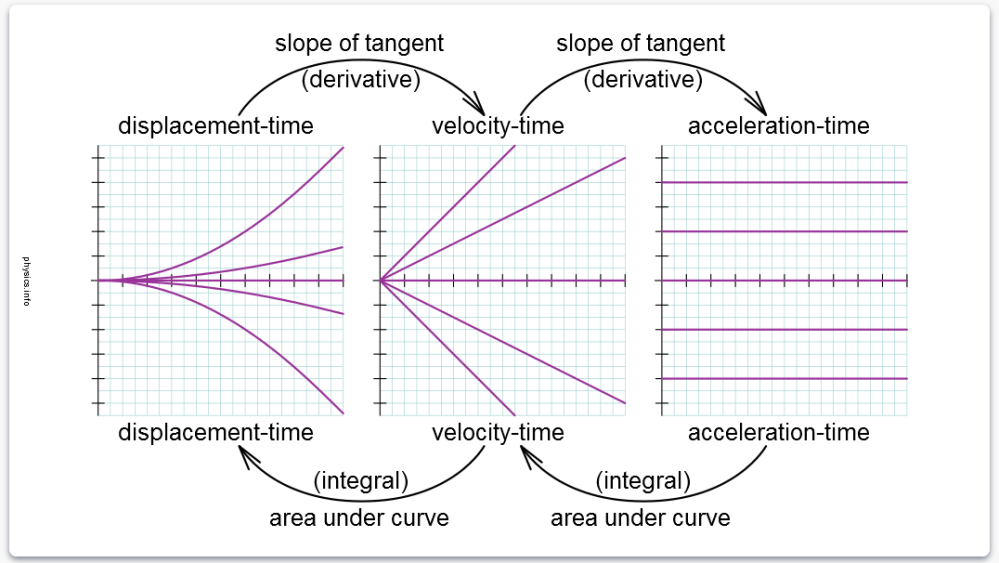
On a displacement-time graph…
-
slope equals velocity.
-
the “y” intercept equals the initial displacement.
-
when two curves coincide, the two objects have the same displacement at that time.
-
straight lines imply constant velocity.
-
curved lines imply acceleration.
-
an object undergoing constant acceleration traces a portion of a parabola.
-
average velocity is the slope of the straight line connecting the endpoints of a curve.
-
instantaneous velocity is the slope of the line tangent to a curve at any point.
-
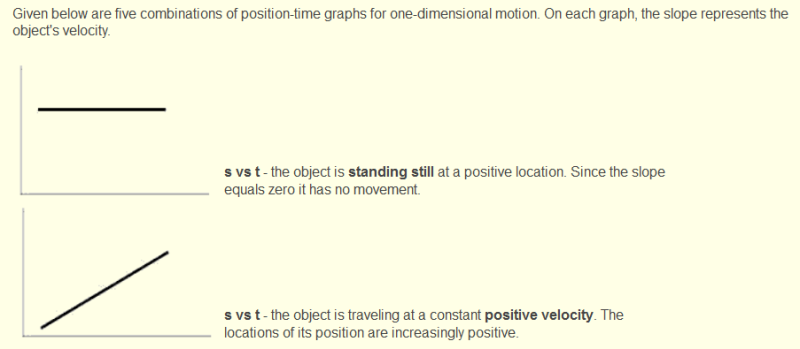
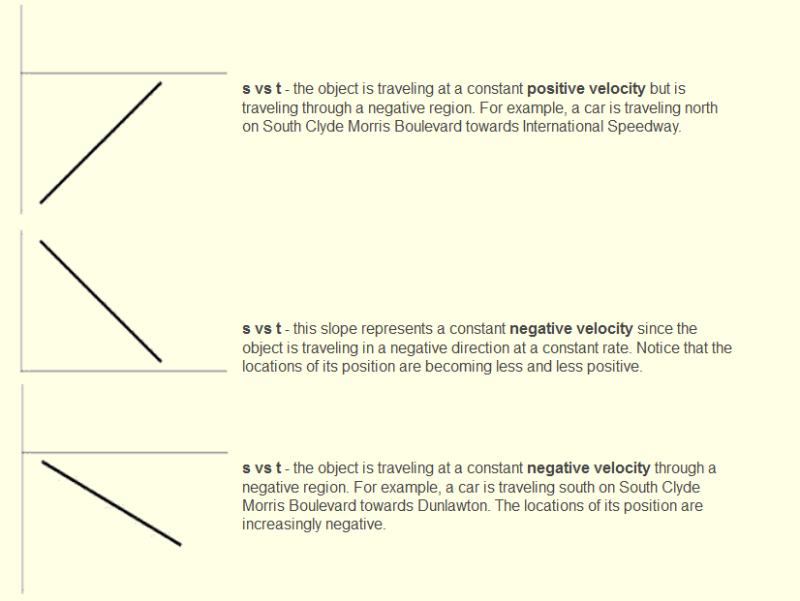
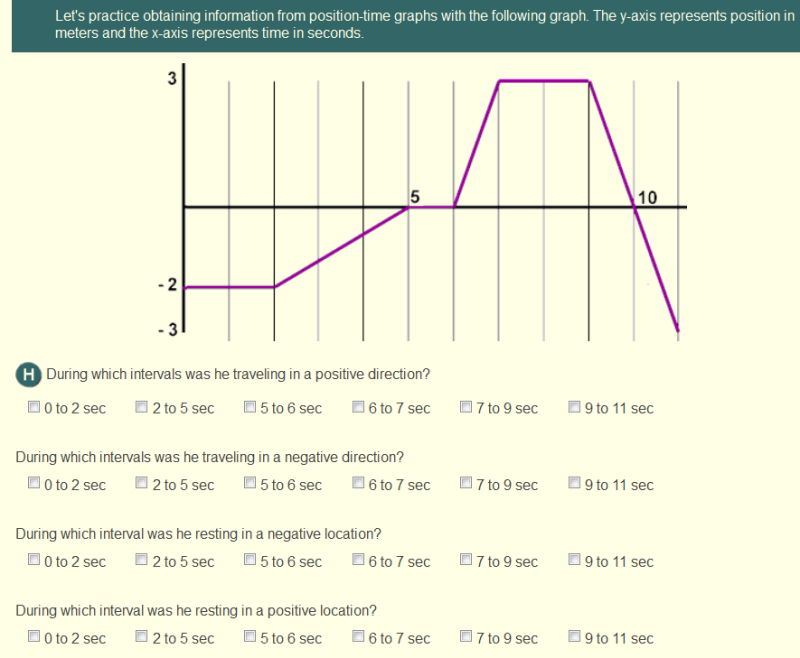
positive slope implies motion in the positive direction.
-
negative slope implies motion in the negative direction.
-
zero slope implies a state of rest.
-
The area under the curve is meaningless
-
-
On a velocity-time graph…
-
slope equals acceleration.
-
the”y” intercept equals the initial velocity.
-
when two curves coincide, the two objects have the same velocity at that time.
-
straight lines imply uniform acceleration.
-
curved lines imply non-uniform acceleration.
-
an object undergoing constant acceleration traces a straight line.
-
average acceleration is the slope of the straight line connecting the endpoints of a curve.
-
instantaneous acceleration is the slope of the line tangent to a curve at any point.
-
positive slope implies an increase in velocity in the positive direction.
-
negative slope implies an increase in velocity in the negative direction.
-
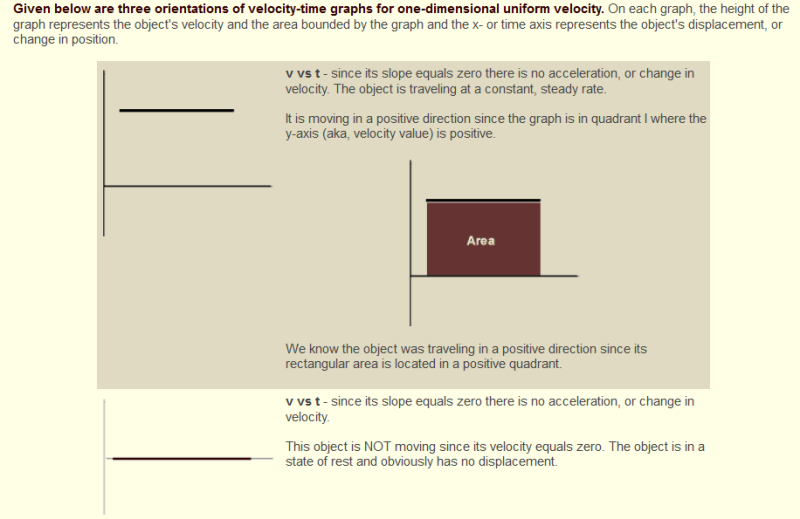
zero slope implies motion with constant velocity.
-
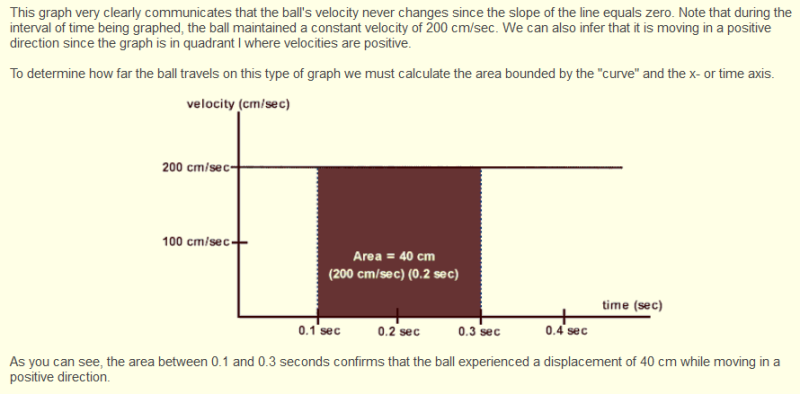
the area under the curve equals the change in displacement.
-
-
On an acceleration-time graph…
-
slope is meaningless.
-
the”y” intercept equals the initial acceleration.
-
when two curves coincide, the two objects have the same acceleration at that time.
-
an object undergoing constant acceleration traces a horizontal line.
-
zero slope implies motion with constant acceleration.
-
the area under the curve equals the change in velocity.
-
-
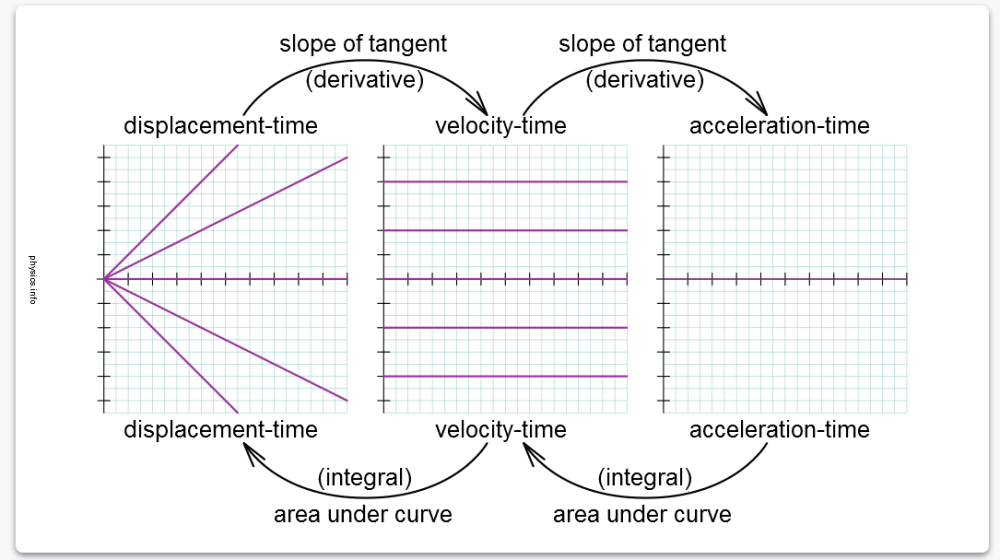
The mathematical transformations between graphs of motion are shown below.
External links
Motion graphs worksheets from MyScienceSite.com
http://physics.info/motion-graphs/practice.shtml
useful worksheets
http://physics.info/motion-graphs/problems.shtml
Click to access worksheet-transform.pdf
Learning standards
2016 Massachusetts Science and Technology/Engineering Standards
HS-PS2-1. Analyze data to support the claim that Newton’s second law of motion is a
mathematical model describing change in motion (the acceleration) of objects when
acted on by a net force.
HS-PS2-10(MA). Use free-body force diagrams, algebraic expressions, and Newton’s laws of motion to predict changes to velocity and acceleration for an object moving in one dimension in various situations.
A Framework for K-12 Science Education: Practices, Crosscutting Concepts, and Core Ideas (2012)
PS2.A Forces and motion. How can one predict an object’s continued motion, changes in motion, or stability?
Massachusetts Science and Technology/Engineering Curriculum Framework (2006)
Introductory Physics. Motion and Forces. Central Concept: Newton’s laws of motion and gravitation describe and predict the motion of most objects.
1.1 Compare and contrast vector quantities (e.g., displacement, velocity, acceleration force, linear momentum) and scalar quantities (e.g., distance, speed, energy, mass, work)
1.2 Distinguish between displacement, distance, velocity, speed, and acceleration. Solve problems involving displacement, distance, velocity, speed, and constant acceleration.
1.3 Create and interpret graphs of 1-dimensional motion, such as position vs. time, distance vs. time, speed vs. time, velocity vs. time, and acceleration vs. time where acceleration is constant.

